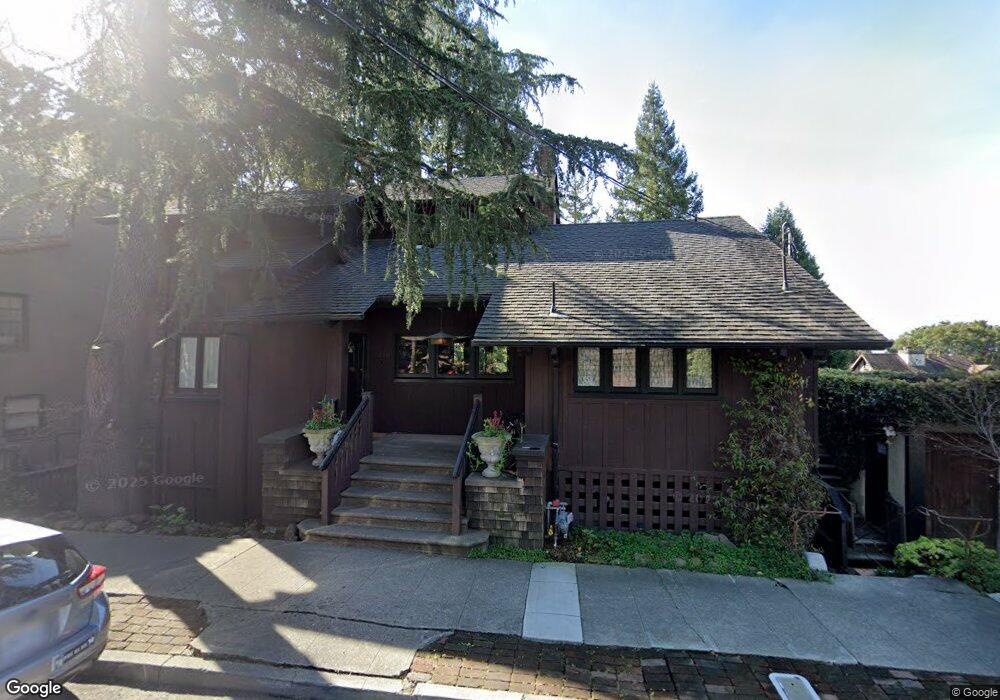
2236 Summer St Berkeley, CA 94709
Berkeley Hills NeighborhoodEstimated Value: $1,709,000 - $2,559,839
3
Beds
4
Baths
1,965
Sq Ft
$1,153/Sq Ft
Est. Value
About This Home
This home is located at 2236 Summer St, Berkeley, CA 94709 and is currently estimated at $2,264,960, approximately $1,152 per square foot. 2236 Summer St is a home located in Alameda County with nearby schools including Cragmont Elementary School, Berkeley Arts Magnet at Whittier School, and Washington Elementary School.
Ownership History
Date
Name
Owned For
Owner Type
Purchase Details
Closed on
Jun 28, 2024
Sold by
Schnick Jurczenia 1988 Family Trust and Jurczenia Mary Jo
Bought by
Schnick Jurczenia 1988 Family Trust and Jurczenia
Current Estimated Value
Purchase Details
Closed on
Apr 9, 2012
Sold by
Jurczenia Mary Jo and Schnick John M
Bought by
Jurczenia Mary Jo and Schnick John M
Create a Home Valuation Report for This Property
The Home Valuation Report is an in-depth analysis detailing your home's value as well as a comparison with similar homes in the area
Home Values in the Area
Average Home Value in this Area
Purchase History
| Date | Buyer | Sale Price | Title Company |
|---|---|---|---|
| Schnick Jurczenia 1988 Family Trust | -- | None Listed On Document | |
| Jurczenia Mary Jo | -- | None Available |
Source: Public Records
Tax History
| Year | Tax Paid | Tax Assessment Tax Assessment Total Assessment is a certain percentage of the fair market value that is determined by local assessors to be the total taxable value of land and additions on the property. | Land | Improvement |
|---|---|---|---|---|
| 2025 | $17,993 | $1,016,512 | $275,956 | $747,556 |
| 2024 | $17,993 | $996,446 | $270,546 | $732,900 |
| 2023 | $17,539 | $983,773 | $265,242 | $718,531 |
| 2022 | $17,338 | $957,484 | $260,041 | $704,443 |
| 2021 | $17,351 | $938,576 | $254,943 | $690,633 |
| 2020 | $16,408 | $935,884 | $252,330 | $683,554 |
| 2019 | $15,728 | $917,538 | $247,384 | $670,154 |
| 2018 | $15,414 | $899,549 | $242,534 | $657,015 |
| 2017 | $14,897 | $881,911 | $237,778 | $644,133 |
| 2016 | $13,929 | $830,307 | $233,116 | $597,191 |
| 2015 | $13,480 | $817,839 | $229,616 | $588,223 |
| 2014 | $12,828 | $799,861 | $225,119 | $574,742 |
Source: Public Records
Map
Nearby Homes
- 2315 Eunice St
- 2121 Eunice St
- 2501 Rose Walk
- 1444 Walnut St
- 1515 Oxford St Unit 1D
- 1408 Henry St
- 1950 Hopkins St
- 1004 Cragmont Ave
- 1622 Scenic Ave
- 2686 Shasta Rd
- 2421 Hilgard Ave
- 1106 Cragmont Ave
- 1425 Martin Luther King jr Way
- 1682 Oxford St
- 2201 Virginia St Unit 2
- 2477 Virginia St
- 2340 Virginia St
- 1165 Cragmont Ave
- 962 Regal Rd
- 2600 Hilgard Ave
Your Personal Tour Guide
Ask me questions while you tour the home.