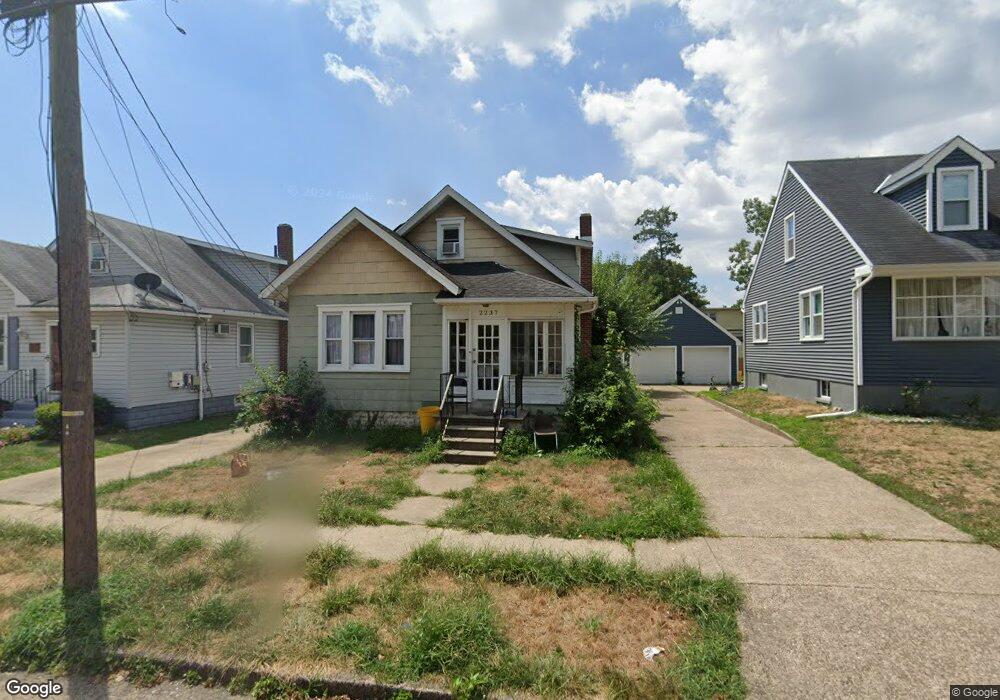
2237 Penn St Pennsauken, NJ 08110
Estimated Value: $281,940 - $346,000
--
Bed
--
Bath
1,489
Sq Ft
$214/Sq Ft
Est. Value
About This Home
This home is located at 2237 Penn St, Pennsauken, NJ 08110 and is currently estimated at $318,485, approximately $213 per square foot. 2237 Penn St is a home located in Camden County with nearby schools including Pennsauken High School, St. Peter Elementary School, and St. Cecilia School.
Ownership History
Date
Name
Owned For
Owner Type
Purchase Details
Closed on
Jul 29, 2005
Sold by
Cornstock James G
Bought by
Moran Scott and Moran Sharon
Current Estimated Value
Home Financials for this Owner
Home Financials are based on the most recent Mortgage that was taken out on this home.
Original Mortgage
$148,410
Outstanding Balance
$78,062
Interest Rate
5.68%
Estimated Equity
$240,423
Purchase Details
Closed on
Sep 30, 1993
Sold by
Linquist Victor J
Bought by
Comstock James G
Home Financials for this Owner
Home Financials are based on the most recent Mortgage that was taken out on this home.
Original Mortgage
$86,000
Interest Rate
6.79%
Mortgage Type
FHA
Create a Home Valuation Report for This Property
The Home Valuation Report is an in-depth analysis detailing your home's value as well as a comparison with similar homes in the area
Home Values in the Area
Average Home Value in this Area
Purchase History
| Date | Buyer | Sale Price | Title Company |
|---|---|---|---|
| Moran Scott | $164,900 | -- | |
| Comstock James G | $85,900 | -- |
Source: Public Records
Mortgage History
| Date | Status | Borrower | Loan Amount |
|---|---|---|---|
| Open | Moran Scott | $148,410 | |
| Previous Owner | Comstock James G | $86,000 |
Source: Public Records
Tax History Compared to Growth
Tax History
| Year | Tax Paid | Tax Assessment Tax Assessment Total Assessment is a certain percentage of the fair market value that is determined by local assessors to be the total taxable value of land and additions on the property. | Land | Improvement |
|---|---|---|---|---|
| 2025 | $5,592 | $222,800 | $46,000 | $176,800 |
| 2024 | $5,484 | $128,500 | $36,500 | $92,000 |
| 2023 | $5,484 | $128,500 | $36,500 | $92,000 |
| 2022 | $4,959 | $128,500 | $36,500 | $92,000 |
| 2021 | $5,092 | $128,500 | $36,500 | $92,000 |
| 2020 | $4,562 | $128,500 | $36,500 | $92,000 |
| 2019 | $4,614 | $128,500 | $36,500 | $92,000 |
| 2018 | $4,639 | $128,500 | $36,500 | $92,000 |
| 2017 | $4,648 | $128,500 | $36,500 | $92,000 |
| 2016 | $4,465 | $125,700 | $36,500 | $89,200 |
| 2015 | $4,598 | $125,700 | $36,500 | $89,200 |
| 2014 | $4,589 | $82,500 | $18,000 | $64,500 |
Source: Public Records
Map
Nearby Homes
- 2269 Marlon Ave
- 2117 Penn St
- 2217 Hillcrest Ave
- 2254 Hollinshed Ave
- 6134 Grant Ave
- 6151 Harvey Ave
- 2429 Norwood Ave
- 1765 Hillcrest Ave
- 2905 N Centre St
- 6116 Rogers Ave
- 1506 Hollinshed Ave
- 5507 Wayne Ave
- 6902 Collins Ave
- 3204 Merchantville Ave
- 5745 Cedar Ave
- 7028 Collins Ave
- 2154 Browning Rd
- 5532 Whitman Terrace
- 116 N Centre St
- 15 W Walnut Ave