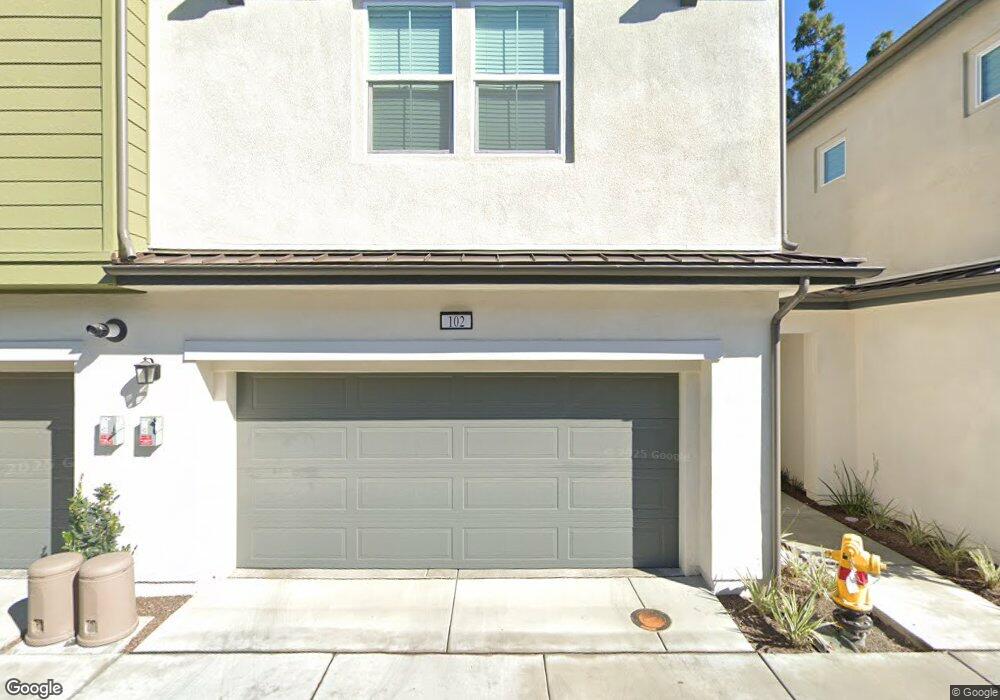
2237 S Fern Ave Ontario, CA 91762
Downtown Ontario NeighborhoodEstimated Value: $489,000 - $562,000
3
Beds
3
Baths
1,399
Sq Ft
$385/Sq Ft
Est. Value
About This Home
This home is located at 2237 S Fern Ave, Ontario, CA 91762 and is currently estimated at $538,940, approximately $385 per square foot. 2237 S Fern Ave is a home located in San Bernardino County with nearby schools including Richard Haynes Elementary, Oaks Middle, and Ontario High School.
Ownership History
Date
Name
Owned For
Owner Type
Purchase Details
Closed on
Apr 6, 2021
Sold by
Macias Lamberto
Bought by
Te Gary
Current Estimated Value
Home Financials for this Owner
Home Financials are based on the most recent Mortgage that was taken out on this home.
Original Mortgage
$324,000
Outstanding Balance
$292,061
Interest Rate
2.9%
Mortgage Type
New Conventional
Estimated Equity
$246,879
Purchase Details
Closed on
Mar 23, 2000
Sold by
Pinedo Jose S
Bought by
Pineda Chris and Pineda Denise
Home Financials for this Owner
Home Financials are based on the most recent Mortgage that was taken out on this home.
Original Mortgage
$102,532
Interest Rate
8.25%
Mortgage Type
FHA
Purchase Details
Closed on
May 19, 1998
Sold by
Hud
Bought by
Pinedo Jose S
Home Financials for this Owner
Home Financials are based on the most recent Mortgage that was taken out on this home.
Original Mortgage
$60,000
Interest Rate
8.12%
Purchase Details
Closed on
Aug 22, 1997
Sold by
Branek James R and Branek Anna M
Bought by
Countrywide Home Loans Inc
Purchase Details
Closed on
May 15, 1997
Sold by
Countrywide Home Loans Inc
Bought by
Hud
Create a Home Valuation Report for This Property
The Home Valuation Report is an in-depth analysis detailing your home's value as well as a comparison with similar homes in the area
Home Values in the Area
Average Home Value in this Area
Purchase History
| Date | Buyer | Sale Price | Title Company |
|---|---|---|---|
| Te Gary | $450,000 | Chicago Title Company | |
| Pineda Chris | $105,000 | First Southwestern Title Co | |
| Pinedo Jose S | $76,000 | First American Title Ins Co | |
| Countrywide Home Loans Inc | $113,440 | Landsafe Title | |
| Hud | -- | Landsafe Title |
Source: Public Records
Mortgage History
| Date | Status | Borrower | Loan Amount |
|---|---|---|---|
| Open | Te Gary | $324,000 | |
| Previous Owner | Pineda Chris | $102,532 | |
| Previous Owner | Pinedo Jose S | $60,000 |
Source: Public Records
Tax History Compared to Growth
Tax History
| Year | Tax Paid | Tax Assessment Tax Assessment Total Assessment is a certain percentage of the fair market value that is determined by local assessors to be the total taxable value of land and additions on the property. | Land | Improvement |
|---|---|---|---|---|
| 2025 | $5,241 | $487,094 | $170,483 | $316,611 |
| 2024 | $5,241 | $477,543 | $167,140 | $310,403 |
| 2023 | $5,094 | $468,180 | $163,863 | $304,317 |
| 2022 | $5,027 | $459,000 | $160,650 | $298,350 |
| 2021 | $2,033 | $181,522 | $63,532 | $117,990 |
| 2020 | $1,997 | $179,661 | $62,881 | $116,780 |
| 2019 | $1,981 | $176,138 | $61,648 | $114,490 |
| 2018 | $1,954 | $172,684 | $60,439 | $112,245 |
| 2017 | $1,884 | $169,298 | $59,254 | $110,044 |
| 2016 | $1,810 | $165,978 | $58,092 | $107,886 |
| 2015 | $1,798 | $163,484 | $57,219 | $106,265 |
| 2014 | $1,743 | $160,281 | $56,098 | $104,183 |
Source: Public Records
Map
Nearby Homes
- 2350 S Via Esplanade Unit 31
- 2333 S Via Esplanade Unit 29
- 2333 S Via Esplanade Unit 25
- 2343 S Via Veranda Unit 10
- 6736 Aster Ct
- 310 E Philadelphia St Unit 35
- 310 E Philadelphia St
- 558 W Philadelphia St
- 12482 Silkleaf Ave
- 320 W Walnut St Unit 51
- 320 W Walnut St Unit 6
- 1949 S Palm Place
- 6763 Poinsettia Ct
- 1940 S Fern Ave
- 2300 S Sultana Ave Unit 298
- 12476 Park Ave
- 2148 S Sultana Ave
- 6703 Poinsettia Ct
- 304 E Cedar St
- 2022 S San Antonio Ave
- 2237 S Fern Ave Unit A
- 2237 S Fern Ave Unit E
- 2237 S Fern Ave
- 2237 S Fern Ave Unit D
- 2237 S Fern Ave Unit C
- 2237 S Fern Ave Unit B
- 2239 S Fern Ave Unit C
- 2239 S Fern Ave
- 2239 S Fern Ave Unit D
- 2239 S Fern Ave Unit B
- 2239 S Fern Ave Unit A
- 2241 S Fern Ave Unit A
- 2241 S Fern Ave Unit 20
- 2241 S Fern Ave Unit C
- 2241 S Fern Ave Unit B
- 2235 UNIT S Fern Avenue Unit D Unit D
- 2235 S Fern Ave
- 2235 S Fern Ave Unit D
- 2235 S Fern Ave Unit C
- 2235 S Fern Ave Unit A