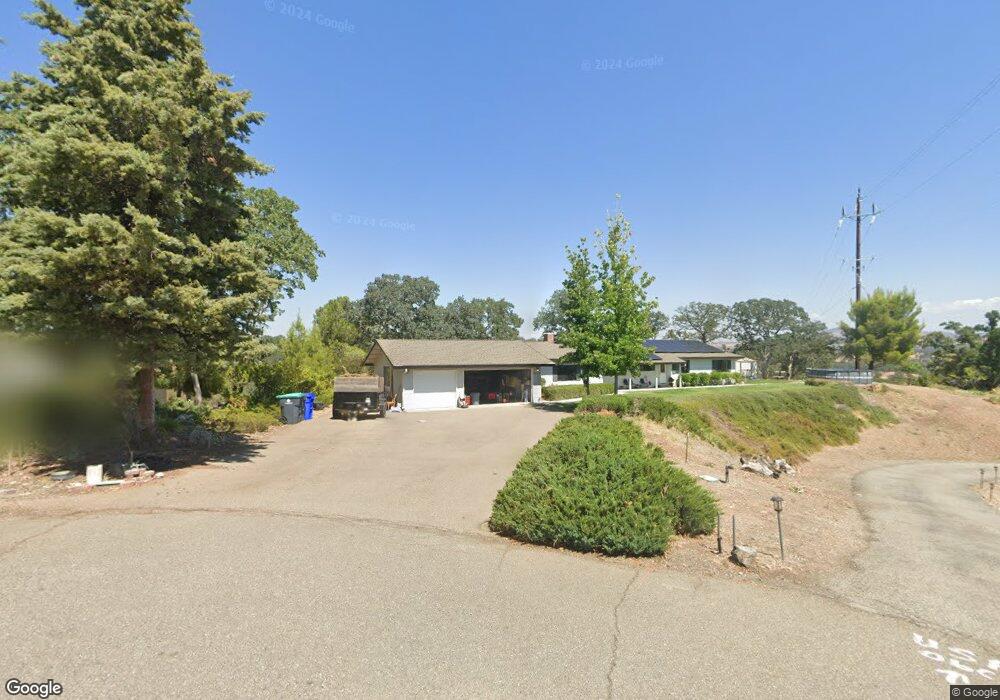
22370 Lariat Ln Red Bluff, CA 96080
Estimated Value: $306,000 - $465,000
4
Beds
2
Baths
2,102
Sq Ft
$186/Sq Ft
Est. Value
About This Home
This home is located at 22370 Lariat Ln, Red Bluff, CA 96080 and is currently estimated at $391,288, approximately $186 per square foot. 22370 Lariat Ln is a home located in Tehama County with nearby schools including William M. Metteer Elementary School, Vista Preparatory Academy, and Red Bluff High School.
Ownership History
Date
Name
Owned For
Owner Type
Purchase Details
Closed on
Jul 28, 2022
Sold by
Paul And Peggy Nipar Trust
Bought by
Munevar Milton A Carrera and Carrera Martiza L
Current Estimated Value
Home Financials for this Owner
Home Financials are based on the most recent Mortgage that was taken out on this home.
Original Mortgage
$272,000
Outstanding Balance
$260,593
Interest Rate
5.78%
Mortgage Type
New Conventional
Estimated Equity
$130,695
Purchase Details
Closed on
Jun 8, 2017
Sold by
Nipar Paul E and Nipar Peggy L
Bought by
Nipar Paul E and Nipar Peggy L
Purchase Details
Closed on
Aug 31, 2015
Sold by
Orwick Charles A
Bought by
Nipar Paul E and Nipar Peggy L
Home Financials for this Owner
Home Financials are based on the most recent Mortgage that was taken out on this home.
Original Mortgage
$251,250
Interest Rate
3.97%
Mortgage Type
New Conventional
Purchase Details
Closed on
Dec 18, 2001
Sold by
Orwick Charles A
Bought by
Orwick Charles A
Create a Home Valuation Report for This Property
The Home Valuation Report is an in-depth analysis detailing your home's value as well as a comparison with similar homes in the area
Purchase History
| Date | Buyer | Sale Price | Title Company |
|---|---|---|---|
| Munevar Milton A Carrera | $340,000 | New Title Company Name | |
| Nipar Paul E | -- | None Available | |
| Nipar Paul E | $335,000 | Placer Title Company | |
| Orwick Charles A | -- | -- |
Source: Public Records
Mortgage History
| Date | Status | Borrower | Loan Amount |
|---|---|---|---|
| Open | Munevar Milton A Carrera | $272,000 | |
| Previous Owner | Nipar Paul E | $251,250 |
Source: Public Records
Tax History
| Year | Tax Paid | Tax Assessment Tax Assessment Total Assessment is a certain percentage of the fair market value that is determined by local assessors to be the total taxable value of land and additions on the property. | Land | Improvement |
|---|---|---|---|---|
| 2025 | $3,542 | $353,736 | $83,232 | $270,504 |
| 2023 | $3,481 | $340,000 | $80,000 | $260,000 |
| 2022 | $1,757 | $164,626 | $42,204 | $122,422 |
| 2021 | $1,686 | $161,399 | $41,377 | $120,022 |
| 2020 | $1,720 | $159,745 | $40,953 | $118,792 |
| 2019 | $1,731 | $156,613 | $40,150 | $116,463 |
| 2018 | $1,601 | $153,543 | $39,363 | $114,180 |
| 2017 | $1,615 | $150,534 | $38,592 | $111,942 |
| 2016 | $1,508 | $147,584 | $37,836 | $109,748 |
| 2015 | -- | $145,368 | $37,268 | $108,100 |
| 2014 | $1,463 | $142,521 | $36,538 | $105,983 |
Source: Public Records
Map
Nearby Homes
- 108 Lot 8 of Tract No 91-1002 Ln
- 22560 Adobe Rd
- 22611 Adobe Rd
- 000 Knob Hill Place
- 00000 Sunriver Dr
- Lot 1 Paynes Creek Rd
- 14115 Trinity Ave
- 176 Casa Grande Dr
- 149 Casa Grande Dr
- 147 Casa Grande Dr
- 139 Casa Grande Dr
- 19 Casa Grande Dr
- 135 Casa Grande Dr
- 123 Casa Grande Dr
- 101 Casa Grande Dr
- 13 Casa Grande Dr
- 1 Casa Grande Dr Unit 1
- 15185 China Rapids Dr
- 23 Casa Grande Dr
- 15460 China Rapids Dr
- 22360 Lariat Ln
- 22365 Lariat Ln
- 22355 Lariat Ln
- 22350 Lariat Ln
- 14685 River Oaks Dr
- 22370 Hitching Post Cir
- 22360 Hitching Post Cir
- 14620 Carriage Ln
- 14615 Carriage Ln
- 14624 Carriage Ln
- 22365 Hitching Post Cir
- 14625 River Oaks Dr
- 22355 Hitching Post Cir
- 14640 River Oaks Dr
- 14625 Carriage Ln
- 14615 River Oaks Dr
- 14680 River Oaks Dr
- 000 River Oaks Dr
- 14690 River Oaks Dr
- 19035 Carriage Ln
Your Personal Tour Guide
Ask me questions while you tour the home.