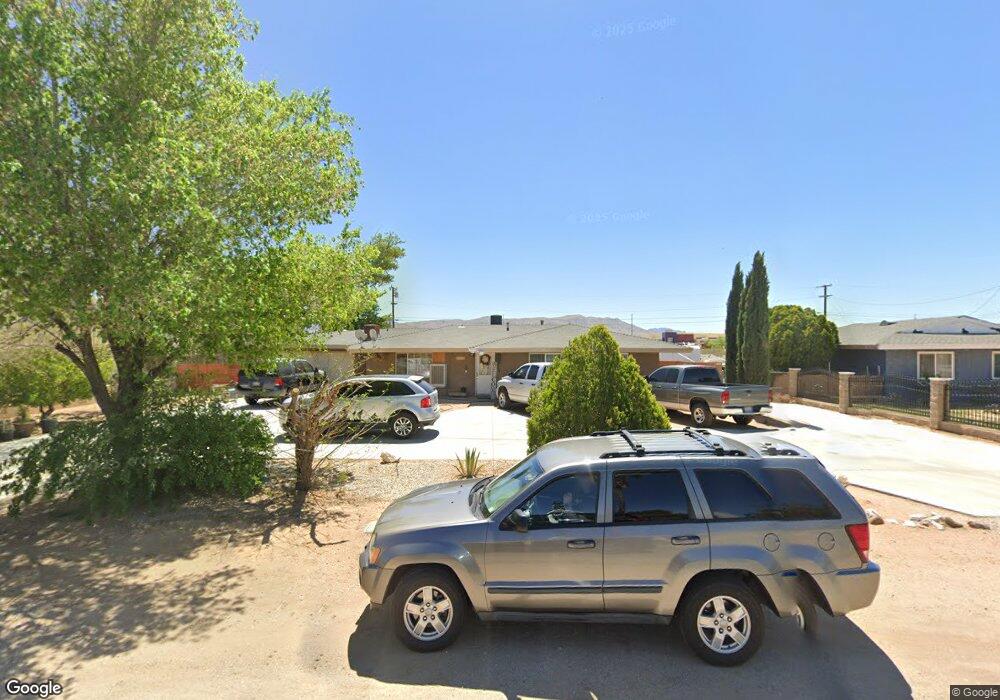
22379 Miramot Rd Apple Valley, CA 92308
High Desert NeighborhoodEstimated Value: $350,587 - $431,000
4
Beds
2
Baths
1,481
Sq Ft
$256/Sq Ft
Est. Value
About This Home
This home is located at 22379 Miramot Rd, Apple Valley, CA 92308 and is currently estimated at $378,647, approximately $255 per square foot. 22379 Miramot Rd is a home located in San Bernardino County with nearby schools including Sandia Elementary School and Apple Valley High School.
Ownership History
Date
Name
Owned For
Owner Type
Purchase Details
Closed on
May 11, 2004
Sold by
Menzel Jaime A and Menzel Imelda D
Bought by
Herrera Jose and Hererra Margarita
Current Estimated Value
Home Financials for this Owner
Home Financials are based on the most recent Mortgage that was taken out on this home.
Original Mortgage
$112,000
Outstanding Balance
$52,512
Interest Rate
5.5%
Mortgage Type
Stand Alone First
Estimated Equity
$326,135
Purchase Details
Closed on
Jan 12, 1995
Sold by
Hud
Bought by
Menzel Jaime A and Menzel Imelda D
Home Financials for this Owner
Home Financials are based on the most recent Mortgage that was taken out on this home.
Original Mortgage
$49,541
Interest Rate
9.03%
Mortgage Type
FHA
Purchase Details
Closed on
Feb 2, 1994
Sold by
Central Pacific Mtg Company
Bought by
Hud
Purchase Details
Closed on
Dec 15, 1993
Sold by
Mortgage Lender Services Inc
Bought by
Central Pacific Mtg Company
Create a Home Valuation Report for This Property
The Home Valuation Report is an in-depth analysis detailing your home's value as well as a comparison with similar homes in the area
Home Values in the Area
Average Home Value in this Area
Purchase History
| Date | Buyer | Sale Price | Title Company |
|---|---|---|---|
| Herrera Jose | $140,000 | Ticor Title Company | |
| Menzel Jaime A | $50,000 | United Title Company | |
| Hud | -- | North American Title Co | |
| Central Pacific Mtg Company | $110,829 | North American Title Company |
Source: Public Records
Mortgage History
| Date | Status | Borrower | Loan Amount |
|---|---|---|---|
| Open | Herrera Jose | $112,000 | |
| Previous Owner | Menzel Jaime A | $49,541 | |
| Closed | Herrera Jose | $28,000 |
Source: Public Records
Tax History Compared to Growth
Tax History
| Year | Tax Paid | Tax Assessment Tax Assessment Total Assessment is a certain percentage of the fair market value that is determined by local assessors to be the total taxable value of land and additions on the property. | Land | Improvement |
|---|---|---|---|---|
| 2025 | $2,249 | $199,053 | $42,654 | $156,399 |
| 2024 | $2,249 | $195,150 | $41,818 | $153,332 |
| 2023 | $2,227 | $191,323 | $40,998 | $150,325 |
| 2022 | $2,192 | $187,571 | $40,194 | $147,377 |
| 2021 | $2,141 | $183,893 | $39,406 | $144,487 |
| 2020 | $2,114 | $182,007 | $39,002 | $143,005 |
| 2019 | $2,073 | $132,200 | $31,500 | $100,700 |
| 2018 | $1,545 | $132,200 | $31,500 | $100,700 |
| 2017 | $1,778 | $123,000 | $29,300 | $93,700 |
| 2016 | $1,287 | $113,900 | $27,100 | $86,800 |
| 2015 | $1,185 | $105,000 | $25,000 | $80,000 |
| 2014 | $843 | $74,800 | $15,000 | $59,800 |
Source: Public Records
Map
Nearby Homes
- 12416 Tonikan Rd
- 22315 Tehama Rd
- 22601 Bear Valley Rd Unit 63
- 22601 Bear Valley Rd Unit 17
- 22601 Bear Valley Rd Unit 70
- 22601 Bear Valley Rd Unit 68
- 22601 Bear Valley Rd Unit 33
- 12595 Central Rd
- 0 Sioux Rd
- 22035 Pahute Rd
- 22838 Bear Valley Rd Unit 106
- 22838 Bear Valley Rd Unit 63
- 10647 Central Rd
- 12409 Pawnee Rd
- 0 Pahute Rd Unit HD25164188
- 0 Little Beaver Rd Unit HD25073438
- 22665 Little Beaver Rd
- 12358 Sioux Rd
- 12584 Mesquite Rd
- 12196 Toltec Dr
- 22393 Miramot Rd
- 22363 Miramot Rd
- 22409 Miramot Rd
- 22370 Miramot Rd
- 22388 Miramot Rd
- 22335 Miramot Rd
- 22350 Miramot Rd
- 22421 Miramot Rd
- 22330 Miramot Rd
- 22422 Miramot Rd
- 22325 Miramot Rd
- 22439 Miramot Rd
- 22371 Sioux Rd
- 22391 Sioux Rd
- 22355 Sioux Rd
- 22405 Sioux Rd
- 22320 Miramot Rd
- 22438 Miramot Rd
- 22335 Sioux Rd
- 22425 Sioux Rd