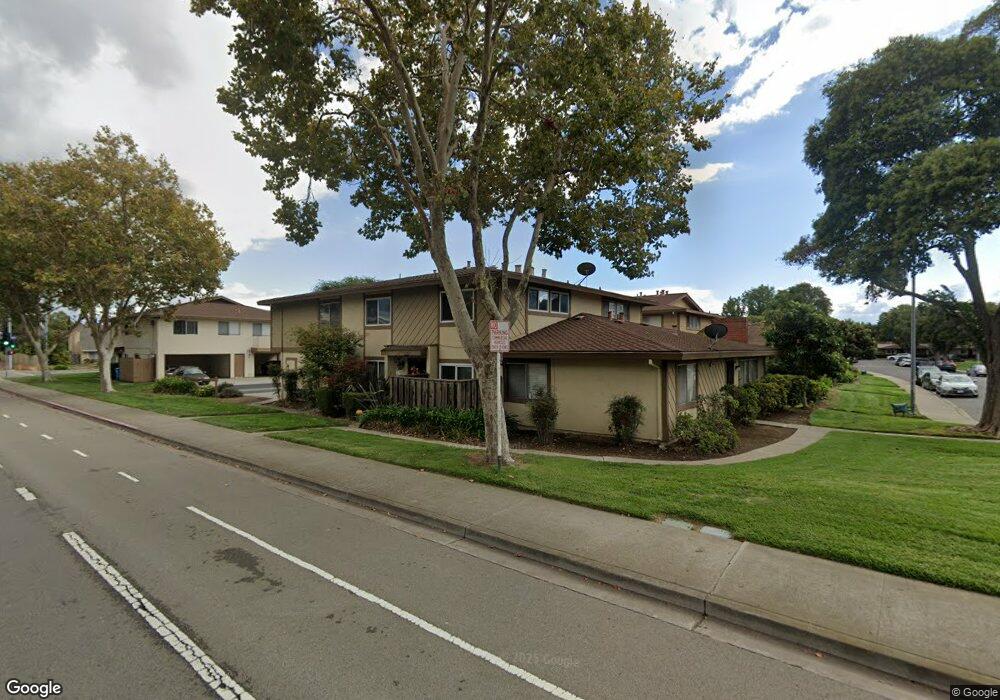
2238 Eric Ct Unit 1 Union City, CA 94587
Estimated Value: $499,000 - $549,000
2
Beds
1
Bath
945
Sq Ft
$557/Sq Ft
Est. Value
About This Home
This home is located at 2238 Eric Ct Unit 1, Union City, CA 94587 and is currently estimated at $526,129, approximately $556 per square foot. 2238 Eric Ct Unit 1 is a home located in Alameda County with nearby schools including Tom Kitayama Elementary School, Cesar Chavez Middle School, and James Logan High School.
Ownership History
Date
Name
Owned For
Owner Type
Purchase Details
Closed on
Nov 5, 2012
Sold by
Miu Kenneth Vai Kun and Miu Lynn Yokelin
Bought by
Zhang Yi
Current Estimated Value
Purchase Details
Closed on
Mar 31, 2012
Sold by
Miu Kenneth Vai Kun and Miu Kenneth V
Bought by
Miu Kenneth Vai Kun and Miu Lynn Yokelin
Purchase Details
Closed on
Aug 4, 2011
Sold by
Wells Fargo Bank Na
Bought by
Miu Kenneth V and Miu Lynn
Purchase Details
Closed on
Jun 15, 2011
Sold by
Zamora Felicidad
Bought by
Wells Fargo Bank Na
Purchase Details
Closed on
Aug 20, 2002
Sold by
Zamora Ramon S
Bought by
Zamora Felicidad
Home Financials for this Owner
Home Financials are based on the most recent Mortgage that was taken out on this home.
Original Mortgage
$183,750
Interest Rate
6.37%
Mortgage Type
Stand Alone First
Create a Home Valuation Report for This Property
The Home Valuation Report is an in-depth analysis detailing your home's value as well as a comparison with similar homes in the area
Home Values in the Area
Average Home Value in this Area
Purchase History
| Date | Buyer | Sale Price | Title Company |
|---|---|---|---|
| Zhang Yi | $200,000 | Chicago Title Company | |
| Miu Kenneth Vai Kun | -- | None Available | |
| Miu Kenneth V | $156,000 | Old Republic Title Company | |
| Wells Fargo Bank Na | $109,761 | Accommodation | |
| Zamora Felicidad | $184,000 | Fidelity National Title Co |
Source: Public Records
Mortgage History
| Date | Status | Borrower | Loan Amount |
|---|---|---|---|
| Previous Owner | Zamora Felicidad | $183,750 |
Source: Public Records
Tax History
| Year | Tax Paid | Tax Assessment Tax Assessment Total Assessment is a certain percentage of the fair market value that is determined by local assessors to be the total taxable value of land and additions on the property. | Land | Improvement |
|---|---|---|---|---|
| 2025 | $4,323 | $246,275 | $73,882 | $172,393 |
| 2024 | $4,323 | $241,447 | $72,434 | $169,013 |
| 2023 | $4,143 | $236,713 | $71,014 | $165,699 |
| 2022 | $4,050 | $232,073 | $69,622 | $162,451 |
| 2021 | $3,963 | $227,523 | $68,257 | $159,266 |
| 2020 | $3,906 | $225,191 | $67,557 | $157,634 |
| 2019 | $3,933 | $220,777 | $66,233 | $154,544 |
| 2018 | $3,839 | $216,450 | $64,935 | $151,515 |
| 2017 | $3,747 | $212,205 | $63,661 | $148,544 |
| 2016 | $3,612 | $208,045 | $62,413 | $145,632 |
| 2015 | $3,541 | $204,921 | $61,476 | $143,445 |
| 2014 | $3,416 | $200,907 | $60,272 | $140,635 |
Source: Public Records
Map
Nearby Homes
- 32368 Derby St
- 32224 Sloccum Ct
- 32608 Brenda Way Unit 4
- 32625 Brenda Way Unit 1
- 32656 Brenda Way Unit 2
- 2676 Great Arbor Way Unit 45
- 2432 Balmoral St
- 2444 Douglas St
- 2449 Almaden Blvd
- 2447 Douglas St
- 3020 San Andreas Dr
- 3131 Grand Lake Dr
- 389 Tropicana Way
- 437 Samoa Cir Unit 437
- 2473 Balmoral St
- 418 Fiji Cir Unit 418
- 179 Kona Cir
- 17 Palm Dr
- 31286 Santa Rita Way
- 33010 Lake Mead Dr
- 2238 Eric Ct
- 2238 Eric Ct Unit 2
- 2238 Eric Ct Unit 3
- 2250 Eric Ct Unit 3
- 2250 Eric Ct
- 2250 Eric Ct Unit 1
- 2250 Eric Ct Unit 4
- 2250 Eric Ct Unit 2
- 2297 Medallion Dr Unit 3
- 2297 Medallion Dr Unit 1
- 2297 Medallion Dr
- 2297 Medallion Dr Unit 4
- 2262 Eric Ct Unit 1
- 2262 Eric Ct Unit 4
- 2262 Eric Ct Unit 3
- 2262 Eric Ct Unit 2
- 2265 Medallion Dr Unit 3
- 2265 Medallion Dr Unit 1
- 2265 Medallion Dr
- 2265 Medallion Dr Unit 2
Your Personal Tour Guide
Ask me questions while you tour the home.