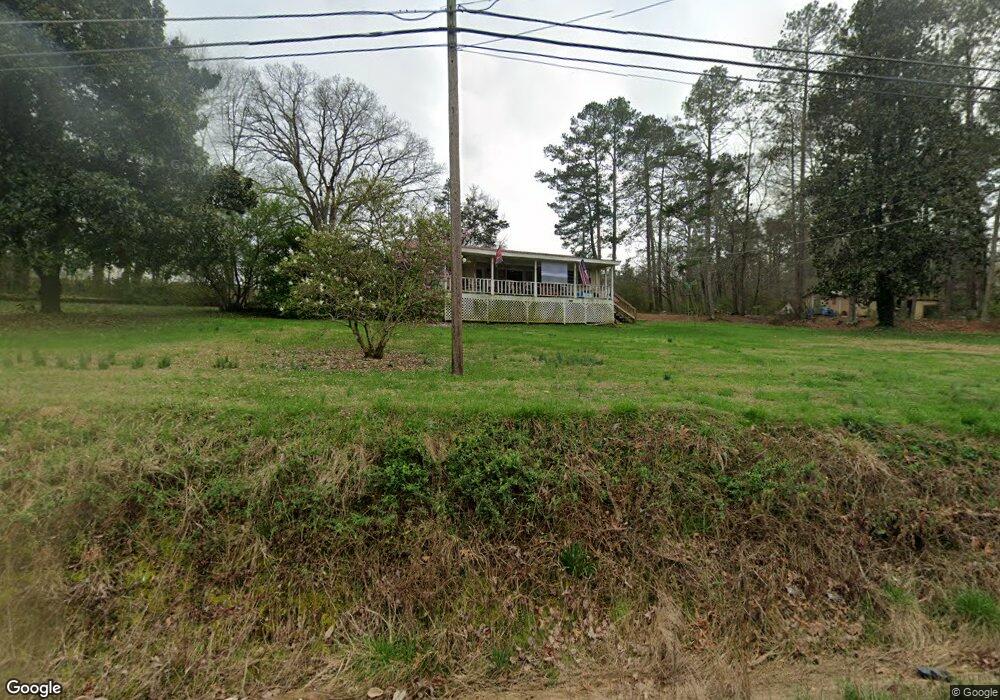
2238 Wax Rd SE Aragon, GA 30104
Estimated Value: $202,000 - $376,000
--
Bed
1
Bath
1,200
Sq Ft
$223/Sq Ft
Est. Value
About This Home
This home is located at 2238 Wax Rd SE, Aragon, GA 30104 and is currently estimated at $267,013, approximately $222 per square foot. 2238 Wax Rd SE is a home located in Floyd County with nearby schools including Pepperell Middle School and Pepperell High School.
Ownership History
Date
Name
Owned For
Owner Type
Purchase Details
Closed on
Mar 24, 2023
Sold by
Humphrey Jackie L
Bought by
Bass Hubbard Cheryl and Bass Matthew Hubbard
Current Estimated Value
Purchase Details
Closed on
Dec 30, 2013
Sold by
Miller Denise
Bought by
Humphrey Jackie L and Humphrey Wanda Humphrey
Purchase Details
Closed on
Sep 8, 2009
Sold by
Harrison Carroll David
Bought by
Miller Denise
Home Financials for this Owner
Home Financials are based on the most recent Mortgage that was taken out on this home.
Original Mortgage
$56,250
Interest Rate
5.22%
Mortgage Type
New Conventional
Purchase Details
Closed on
Oct 28, 1994
Sold by
Harrison Donna
Bought by
Harrison Carroll David
Purchase Details
Closed on
Sep 24, 1991
Sold by
Mills Pauline
Bought by
Harrison Donna
Purchase Details
Closed on
Jan 31, 1977
Sold by
Cole Cora Lee
Bought by
Mills Pauline
Purchase Details
Closed on
Nov 28, 1954
Sold by
Cole H A
Bought by
Cole Cora Lee
Purchase Details
Closed on
Aug 10, 1946
Bought by
Cole H A
Create a Home Valuation Report for This Property
The Home Valuation Report is an in-depth analysis detailing your home's value as well as a comparison with similar homes in the area
Home Values in the Area
Average Home Value in this Area
Purchase History
| Date | Buyer | Sale Price | Title Company |
|---|---|---|---|
| Bass Hubbard Cheryl | $365,000 | -- | |
| Humphrey Jackie L | $43,300 | -- | |
| Miller Denise | $43,700 | -- | |
| Harrison Carroll David | -- | -- | |
| Harrison Donna | -- | -- | |
| Mills Pauline | -- | -- | |
| Cole Cora Lee | -- | -- | |
| Cole H A | -- | -- |
Source: Public Records
Mortgage History
| Date | Status | Borrower | Loan Amount |
|---|---|---|---|
| Previous Owner | Miller Denise | $56,250 |
Source: Public Records
Tax History Compared to Growth
Tax History
| Year | Tax Paid | Tax Assessment Tax Assessment Total Assessment is a certain percentage of the fair market value that is determined by local assessors to be the total taxable value of land and additions on the property. | Land | Improvement |
|---|---|---|---|---|
| 2024 | $2,013 | $72,107 | $22,739 | $49,368 |
| 2023 | $609 | $51,786 | $20,672 | $31,114 |
| 2022 | $561 | $41,338 | $16,994 | $24,344 |
| 2021 | $538 | $36,280 | $15,340 | $20,940 |
| 2020 | $504 | $33,197 | $13,340 | $19,857 |
| 2019 | $494 | $32,095 | $13,340 | $18,755 |
| 2018 | $482 | $30,378 | $12,706 | $17,672 |
| 2017 | $464 | $28,773 | $11,765 | $17,008 |
| 2016 | $470 | $28,208 | $11,760 | $16,448 |
| 2015 | $842 | $28,208 | $11,760 | $16,448 |
| 2014 | $842 | $28,208 | $11,760 | $16,448 |
Source: Public Records
Map
Nearby Homes
- 52 Lloyd Dr SE
- 2557 Wax Rd SE
- 110 Williams Rd SE
- 1337 Abrams Rd SE
- 463 Compton Rd SE
- 1424 Harmony Rd SE
- 838 Pleasant Hope Rd SE
- 12 Lakemont Dr SE
- 16 Hardin Dr SE
- 894 Wax Rd SE
- 150 Pleasant Hope Rd SE
- 320 Brumbelow Rd
- 682 Wax Rd SE
- 5712 Rockmart Rd SE
- 2011 Bailey Rd SE
- 1561 Pleasant Valley Rd SE
- 1531 Old Rockmart Rd SE
- 344 Powell Rd SE
- 6792 Rockmart Rd SE
- 4622 Rockmart Rd SE
- 2238 Wax Rd SE Unit A
- 2238 Wax Rd SE
- 2238 Wax Rd SE
- 2238 Wax Rd SE
- 2238 Wax Rd SE
- 2238 Wax Rd SE Unit A
- 2210 Wax Rd SE
- 25 Lloyd Cir
- 12 Lloyd Cir
- 35 Lloyd Cir
- 0 Lloyd Cir SE
- 2181 Wax Rd SE
- 2178 Wax Rd SE
- 2178 Wax Rd SE
- 60 Lloyd Cir
- 60 Lloyd Cir
- 2324 Wax Rd SE
- 30 Lloyd Dr SE
- 32 Lloyd Dr SE
- 58 Lloyd Dr SE