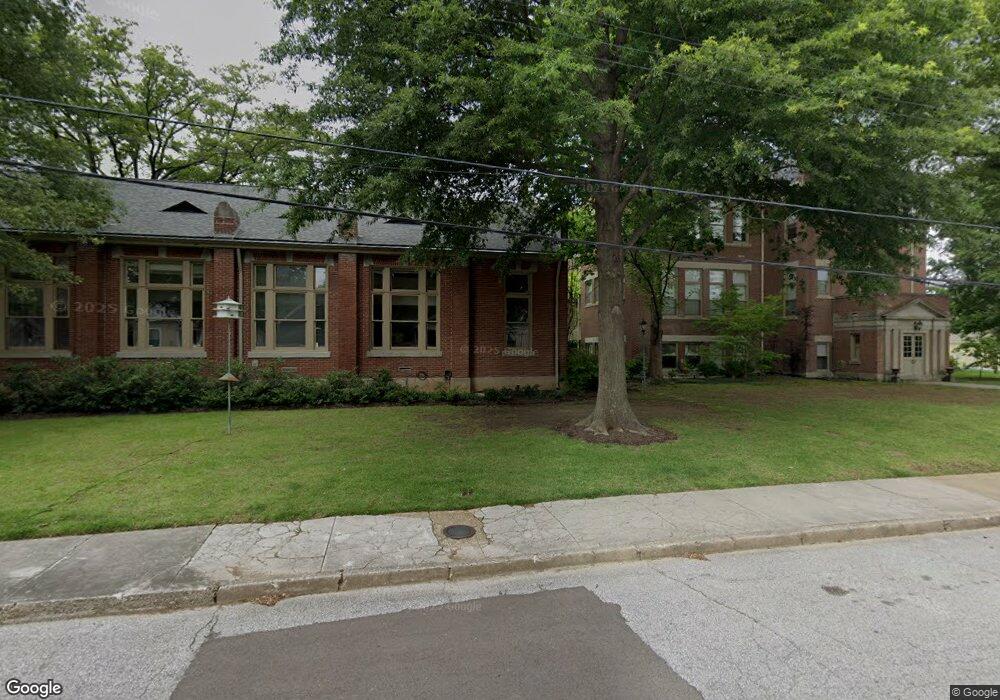
2239 Brewers Landing Unit A5 Memphis, TN 38104
Cooper-Young NeighborhoodEstimated Value: $142,928 - $223,000
1
Bed
1
Bath
868
Sq Ft
$211/Sq Ft
Est. Value
About This Home
This home is located at 2239 Brewers Landing Unit A5, Memphis, TN 38104 and is currently estimated at $182,732, approximately $210 per square foot. 2239 Brewers Landing Unit A5 is a home located in Shelby County with nearby schools including Idlewild Elementary School, Central High School, and Compass Community School Midtown Campus.
Ownership History
Date
Name
Owned For
Owner Type
Purchase Details
Closed on
Sep 28, 2005
Sold by
Wilkinson Samuel Allen
Bought by
Lucchesi Ronald C
Current Estimated Value
Home Financials for this Owner
Home Financials are based on the most recent Mortgage that was taken out on this home.
Original Mortgage
$99,920
Outstanding Balance
$53,313
Interest Rate
5.71%
Mortgage Type
Fannie Mae Freddie Mac
Estimated Equity
$129,419
Purchase Details
Closed on
Jan 20, 1999
Sold by
Carpenter Daniel A and Carpenter Graves S
Bought by
Wilkinson Samuel Allen
Home Financials for this Owner
Home Financials are based on the most recent Mortgage that was taken out on this home.
Original Mortgage
$64,515
Interest Rate
6.71%
Mortgage Type
FHA
Create a Home Valuation Report for This Property
The Home Valuation Report is an in-depth analysis detailing your home's value as well as a comparison with similar homes in the area
Home Values in the Area
Average Home Value in this Area
Purchase History
| Date | Buyer | Sale Price | Title Company |
|---|---|---|---|
| Lucchesi Ronald C | $124,900 | -- | |
| Wilkinson Samuel Allen | $66,000 | -- |
Source: Public Records
Mortgage History
| Date | Status | Borrower | Loan Amount |
|---|---|---|---|
| Open | Lucchesi Ronald C | $99,920 | |
| Previous Owner | Wilkinson Samuel Allen | $64,515 | |
| Closed | Lucchesi Ronald C | $18,735 |
Source: Public Records
Tax History Compared to Growth
Tax History
| Year | Tax Paid | Tax Assessment Tax Assessment Total Assessment is a certain percentage of the fair market value that is determined by local assessors to be the total taxable value of land and additions on the property. | Land | Improvement |
|---|---|---|---|---|
| 2025 | $1,052 | $40,050 | $2,850 | $37,200 |
| 2024 | $1,052 | $31,025 | $2,850 | $28,175 |
| 2023 | $1,890 | $31,025 | $2,850 | $28,175 |
| 2022 | $1,890 | $31,025 | $2,850 | $28,175 |
| 2021 | $1,912 | $31,025 | $2,850 | $28,175 |
| 2020 | $1,850 | $25,525 | $2,850 | $22,675 |
| 2019 | $1,850 | $25,525 | $2,850 | $22,675 |
| 2018 | $1,850 | $25,525 | $2,850 | $22,675 |
| 2017 | $1,049 | $25,525 | $2,850 | $22,675 |
| 2016 | $1,143 | $26,150 | $0 | $0 |
| 2014 | $1,143 | $26,150 | $0 | $0 |
Source: Public Records
Map
Nearby Homes
- 2242 Vinton Ave
- 2275 Edgewood Cove
- 2284 Edgewood Cove
- 521 Summitt St
- 519 Summitt St
- 2277 Union Ave Unit 304
- 2277 Union Ave Unit 105
- 2277 Union Ave Unit 502
- 585 E Parkway S Unit 8
- 585 E Parkway S Unit 5
- 2245 Monroe Ave
- 2188 Cowden Ave
- 615 East Pkwy S
- 2197 Cowden Ave
- 2096 Linden Ave
- 2186 Monroe Ave
- 2092 Linden Ave
- 2080 Vinton Ave
- 2245 Madison Ave
- 15 S Cox St
- 2237 Brewers Landing Unit 4
- 2237 Brewers Landing Unit A4
- 2241 Brewers Landing Unit A6
- 2235 Brewers Landing Unit A3
- 519 S Edgewood St Unit 305
- 519 S Edgewood St Unit 302-5
- 519 S Edgewood St Unit 30230
- 519 S Edgewood St Unit 306
- 519 S Edgewood St Unit 304
- 519 S Edgewood St Unit 303
- 519 S Edgewood St Unit 206
- 519 S Edgewood St Unit 205
- 519 S Edgewood St Unit 204
- 519 S Edgewood St Unit 203
- 519 S Edgewood St Unit 202
- 519 S Edgewood St Unit 201
- 519 S Edgewood St Unit 106
- 519 S Edgewood St Unit 105
- 519 S Edgewood St Unit 104
- 519 S Edgewood St Unit 103