Estimated Value: $375,965 - $409,000
4
Beds
2
Baths
1,144
Sq Ft
$343/Sq Ft
Est. Value
About This Home
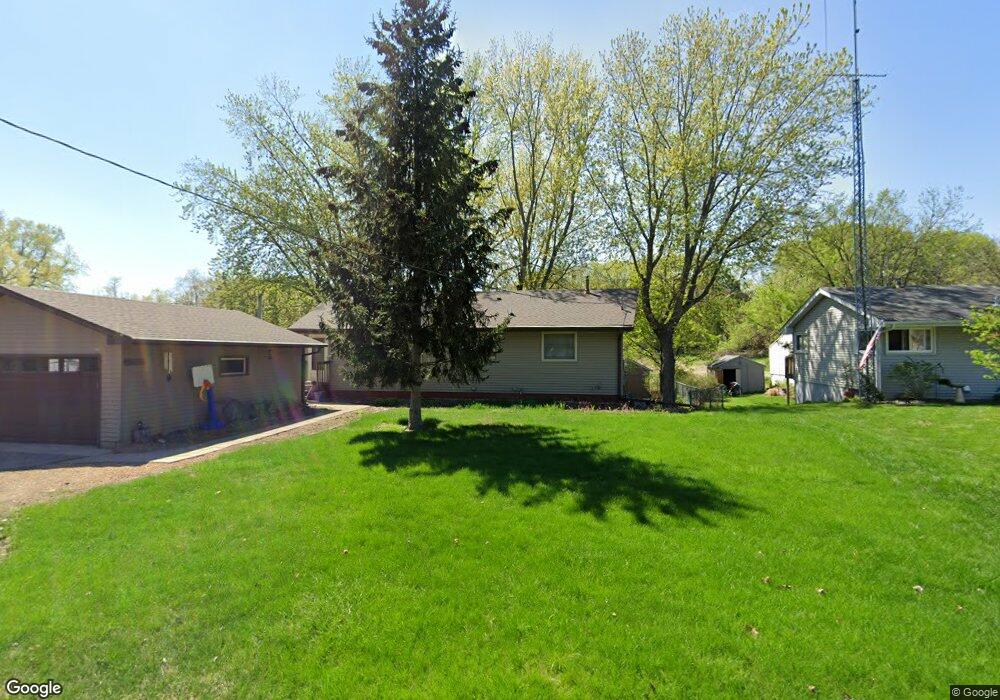
This home is located at 2239 Langdon Ln, Mound, MN 55364 and is currently estimated at $392,491, approximately $343 per square foot. 2239 Langdon Ln is a home located in Hennepin County with nearby schools including Hilltop Primary School, Westonka Middle School, and Westonka High School.
Ownership History
Date
Name
Owned For
Owner Type
Purchase Details
Closed on
May 8, 2017
Sold by
Crc Holdings Llc
Bought by
Peterson Cory and Peterson Sarah
Current Estimated Value
Home Financials for this Owner
Home Financials are based on the most recent Mortgage that was taken out on this home.
Original Mortgage
$261,155
Outstanding Balance
$217,420
Interest Rate
4.14%
Mortgage Type
New Conventional
Estimated Equity
$175,071
Purchase Details
Closed on
Feb 16, 2017
Sold by
Cole Charles R and Cole Amy K
Bought by
Crc Holdings Llc
Purchase Details
Closed on
Oct 27, 2016
Sold by
Baumel Philip
Bought by
Cole Charles R and Cole Amy K
Home Financials for this Owner
Home Financials are based on the most recent Mortgage that was taken out on this home.
Original Mortgage
$152,000
Interest Rate
3.48%
Mortgage Type
New Conventional
Purchase Details
Closed on
Mar 5, 2012
Sold by
Baumel Philip and Baumel Sharon L
Bought by
Baumel Philip and Baumel Sharon
Create a Home Valuation Report for This Property
The Home Valuation Report is an in-depth analysis detailing your home's value as well as a comparison with similar homes in the area
Home Values in the Area
Average Home Value in this Area
Purchase History
| Date | Buyer | Sale Price | Title Company |
|---|---|---|---|
| Peterson Cory | $274,900 | Global Closing & Title Svcs | |
| Crc Holdings Llc | -- | None Available | |
| Cole Charles R | $190,000 | Liberty Title Inc | |
| Baumel Philip | -- | None Available |
Source: Public Records
Mortgage History
| Date | Status | Borrower | Loan Amount |
|---|---|---|---|
| Open | Peterson Cory | $261,155 | |
| Previous Owner | Cole Charles R | $152,000 |
Source: Public Records
Tax History
| Year | Tax Paid | Tax Assessment Tax Assessment Total Assessment is a certain percentage of the fair market value that is determined by local assessors to be the total taxable value of land and additions on the property. | Land | Improvement |
|---|---|---|---|---|
| 2024 | $3,574 | $339,900 | $76,500 | $263,400 |
| 2023 | $3,616 | $351,900 | $85,500 | $266,400 |
| 2022 | $3,275 | $347,000 | $91,000 | $256,000 |
| 2021 | $3,198 | $289,000 | $71,000 | $218,000 |
| 2020 | $3,301 | $282,000 | $71,000 | $211,000 |
| 2019 | $3,216 | $272,000 | $62,000 | $210,000 |
| 2018 | $2,684 | $263,000 | $62,000 | $201,000 |
| 2017 | $2,451 | $195,000 | $55,000 | $140,000 |
| 2016 | $2,216 | $174,000 | $48,000 | $126,000 |
| 2015 | $2,159 | $169,000 | $43,000 | $126,000 |
| 2014 | -- | $158,000 | $46,000 | $112,000 |
Source: Public Records
Map
Nearby Homes
- 2150 Old School Rd Unit 351
- 2150 Old School Rd Unit 354
- 6015 Aspen Rd
- 5760 Village Trail
- 5735 Village Trail Unit 5735
- 5773 Grandview Blvd
- 2350 Harbor Place Unit 214
- 2350 Harbor Place Unit 309
- 6240 Red Oak Rd
- 5782 Bartlett Blvd
- 2670 Commerce Blvd Unit 202
- 2134 Basswood Ln
- 5449 Lost Lake Ln
- 5441 Lost Lake Ln
- 5446 Bartlett Blvd
- 1800 Commerce Blvd
- 5450 Three Points Blvd Unit 623
- 5440 Three Points Blvd Unit 513
- 5440 Three Points Blvd Unit 525
- 5440 Three Points Blvd Unit 536
- 2235 Langdon Ln
- 2259 Langdon Ln
- 2223 Langdon Ln
- 2248 Langdon Ln
- 2270 Langdon Ln
- 2270 Langdon Ln
- 2236 Langdon Ln
- xxxx Langdon
- 2211 Langdon Ln
- 2224 Langdon Ln
- 5935 Lynwood Blvd
- 2212 Langdon Ln
- 5925 Lynwood Blvd
- 5954 Chestnut Rd
- 5945 Lynwood Blvd
- 5966 Chestnut Rd
- 5901 Lynwood Blvd
- 5885 Lynwood Blvd
- 5951 Lynwood Blvd
- 5976 Chestnut Rd
Your Personal Tour Guide
Ask me questions while you tour the home.