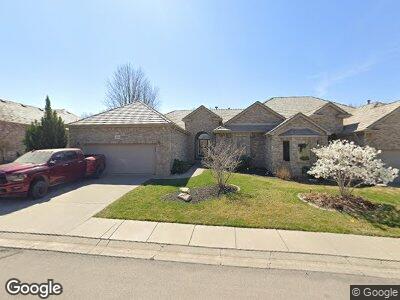
2239 Stone Creek Loop N Lincoln, NE 68512
Estimated Value: $497,625 - $561,000
About This Home
Breathtaking 2 Bedroom Family Home! Photos Coming Soon!
This lovely 2 story home will soon be available to rent! Open concept in the Living-room, dining-room, and kitchen. The main floor features both bedrooms including the master with an on suite! The lower level is a very spacious finished basement! Has a beautiful large deck and back yard. Includes a two stall garage. Washer and dryer Included! Tenants are pay for all utilities but garbage. Good news, HOA takes care of all snow and lawn care. This home is also pent friendly to all pets! There is a one time pet fee of $250, pet rent is $25(per), and 2 pet maximum.
Home will be ready to rent mid January!
-2 stall garage
-Washer/dryer
-Cats and dogs
Photos of the home are coming soon!
Ownership History
Purchase Details
Home Financials for this Owner
Home Financials are based on the most recent Mortgage that was taken out on this home.Home Values in the Area
Average Home Value in this Area
Purchase History
| Date | Buyer | Sale Price | Title Company |
|---|---|---|---|
| Beeman William L | $292,000 | Ntc |
Mortgage History
| Date | Status | Borrower | Loan Amount |
|---|---|---|---|
| Closed | Abcb Llc | $392,000 | |
| Closed | Beeman William L | $241,722 | |
| Closed | Beeman William L | $251,000 | |
| Closed | Hoback Robert P | $230,300 |
Property History
| Date | Event | Price | Change | Sq Ft Price |
|---|---|---|---|---|
| 11/29/2024 11/29/24 | Off Market | $2,750 | -- | -- |
| 10/25/2024 10/25/24 | For Rent | $2,750 | -- | -- |
Tax History Compared to Growth
Tax History
| Year | Tax Paid | Tax Assessment Tax Assessment Total Assessment is a certain percentage of the fair market value that is determined by local assessors to be the total taxable value of land and additions on the property. | Land | Improvement |
|---|---|---|---|---|
| 2024 | $6,230 | $450,800 | $65,000 | $385,800 |
| 2023 | $7,555 | $450,800 | $71,500 | $379,300 |
| 2022 | $7,298 | $366,200 | $71,500 | $294,700 |
| 2021 | $7,372 | $366,200 | $71,500 | $294,700 |
| 2020 | $6,678 | $349,100 | $71,500 | $277,600 |
| 2019 | $6,523 | $349,100 | $71,500 | $277,600 |
| 2018 | $0 | $342,900 | $66,000 | $276,900 |
| 2017 | $0 | $342,900 | $66,000 | $276,900 |
| 2016 | $6,523 | $335,000 | $66,000 | $269,000 |
| 2015 | $6,478 | $335,000 | $66,000 | $269,000 |
| 2014 | $5,743 | $295,300 | $66,000 | $229,300 |
| 2013 | -- | $295,300 | $66,000 | $229,300 |
Map
- 2400 Scotch Pine Trail
- 2435 Grainger Pkwy
- 2311 Grainger Pkwy
- 9000 Keystone Dr
- 9129 Del Rio Dr
- 2111 Herel St
- 8260 S Tularosa Ln
- 8200 S 16th St
- 2110 Herel St
- 9002 S 31st St
- 7264 Helen Witt Dr
- 10225 S 33rd St
- 10301 S 33rd St
- 10310 S 33rd St
- 10323 S 33rd St
- 10235 S 33rd St
- 7700 O'Rourke Dr
- 7641 Brummond Dr
- 2963 Ridgegate
- 7220 S 21st St
- 2239 Stone Creek Loop N
- 2233 Stone Creek Loop N
- 2247 Stone Creek Loop N
- 2225 Stone Creek Loop N
- 2253 Stone Creek Loop N
- 2228 Stone Creek Loop S
- 2222 Stone Creek Loop S
- 2236 Stone Creek Loop S
- 2219 Stone Creek Loop N
- 2240 Stone Creek Loop N
- 2246 Stone Creek Loop N
- 2232 Stone Creek Loop N
- 2309 Stone Creek Loop N
- 2214 Stone Creek Loop S
- 2242 Stone Creek Loop S
- 2226 Stone Creek Loop N
- 2300 Stone Creek Loop N
- 2208 Stone Creek Loop S
- 2211 Stone Creek Loop N
- 2308 Stone Creek Loop S