Estimated Value: $1,781,121 - $1,983,000
4
Beds
3
Baths
1,847
Sq Ft
$1,006/Sq Ft
Est. Value
About This Home
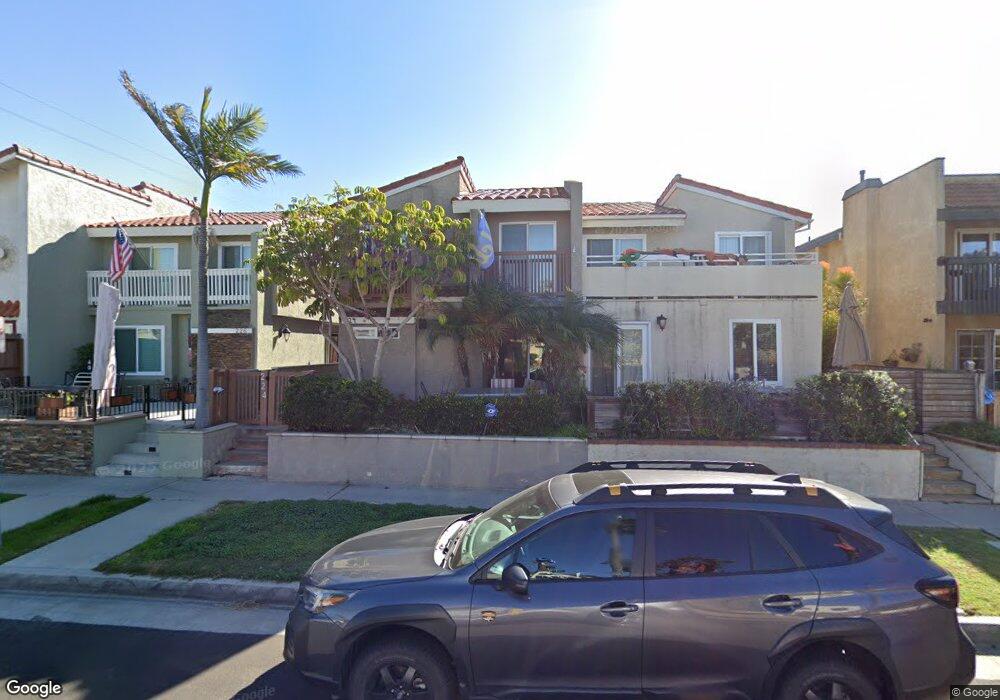
This home is located at 224 19th St, Huntington Beach, CA 92648 and is currently estimated at $1,858,530, approximately $1,006 per square foot. 224 19th St is a home located in Orange County with nearby schools including Agnes L. Smith Elementary, Ethel Dwyer Middle, and Huntington Beach High School.
Ownership History
Date
Name
Owned For
Owner Type
Purchase Details
Closed on
Oct 4, 2023
Sold by
Caric Family Trust and Caric Louis A
Bought by
Caric Louis Andrew and Schultz Tracee Michelle
Current Estimated Value
Purchase Details
Closed on
Oct 17, 2014
Sold by
Caric Louis S
Bought by
Caric Louis S and The Caric Family Trust
Home Financials for this Owner
Home Financials are based on the most recent Mortgage that was taken out on this home.
Original Mortgage
$315,100
Interest Rate
4.2%
Mortgage Type
New Conventional
Purchase Details
Closed on
Apr 11, 2014
Sold by
Caric Louis
Bought by
Carie Louis S and Caric Family Trust
Home Financials for this Owner
Home Financials are based on the most recent Mortgage that was taken out on this home.
Original Mortgage
$319,000
Interest Rate
4.23%
Mortgage Type
New Conventional
Purchase Details
Closed on
Dec 13, 2012
Sold by
Caric Louis S
Bought by
Caric Louis S and Caric Family Trust
Purchase Details
Closed on
Dec 29, 2009
Sold by
Ewell S Jason and Ewell Andrea T
Bought by
Caric Louis S
Home Financials for this Owner
Home Financials are based on the most recent Mortgage that was taken out on this home.
Original Mortgage
$375,000
Interest Rate
4.77%
Mortgage Type
New Conventional
Purchase Details
Closed on
Feb 14, 2002
Sold by
Gates Michael C and Gates Cheryl T
Bought by
Ewell S Jason and Ewell Andrea T
Home Financials for this Owner
Home Financials are based on the most recent Mortgage that was taken out on this home.
Original Mortgage
$392,000
Interest Rate
7.25%
Purchase Details
Closed on
May 16, 2001
Sold by
Gates Cheryl T and Kane Cheryl
Bought by
Gates Michael C and Gates Cheryl T
Home Financials for this Owner
Home Financials are based on the most recent Mortgage that was taken out on this home.
Original Mortgage
$348,750
Interest Rate
7.03%
Purchase Details
Closed on
Sep 1, 1998
Sold by
Holler David W and Holler Danielle M
Bought by
Kane Cheryl
Home Financials for this Owner
Home Financials are based on the most recent Mortgage that was taken out on this home.
Original Mortgage
$271,900
Interest Rate
6.88%
Purchase Details
Closed on
Jun 10, 1997
Sold by
Hoffman James J and Hoffman Charlotte Charlotte
Bought by
Holler David W and Holler Danielle M
Home Financials for this Owner
Home Financials are based on the most recent Mortgage that was taken out on this home.
Original Mortgage
$241,200
Interest Rate
7.62%
Create a Home Valuation Report for This Property
The Home Valuation Report is an in-depth analysis detailing your home's value as well as a comparison with similar homes in the area
Home Values in the Area
Average Home Value in this Area
Purchase History
| Date | Buyer | Sale Price | Title Company |
|---|---|---|---|
| Caric Louis Andrew | -- | None Listed On Document | |
| Caric Louis S | -- | Title365 | |
| Carie Louis S | -- | Title365 | |
| Carie Louis S | -- | Accommodation | |
| Caric Louis | -- | Title365 | |
| Caric Louis S | -- | None Available | |
| Caric Louis S | $825,000 | Lawyers Title | |
| Ewell S Jason | $490,000 | Equity Title Company | |
| Gates Michael C | -- | Chicago Title Co | |
| Kane Cheryl | $340,000 | California Counties Title Co | |
| Holler David W | $268,000 | Benefit Land Title Company |
Source: Public Records
Mortgage History
| Date | Status | Borrower | Loan Amount |
|---|---|---|---|
| Previous Owner | Carie Louis S | $315,100 | |
| Previous Owner | Caric Louis | $319,000 | |
| Previous Owner | Caric Louis S | $375,000 | |
| Previous Owner | Ewell S Jason | $392,000 | |
| Previous Owner | Gates Michael C | $348,750 | |
| Previous Owner | Kane Cheryl | $271,900 | |
| Previous Owner | Holler David W | $241,200 | |
| Closed | Kane Cheryl | $50,950 |
Source: Public Records
Tax History Compared to Growth
Tax History
| Year | Tax Paid | Tax Assessment Tax Assessment Total Assessment is a certain percentage of the fair market value that is determined by local assessors to be the total taxable value of land and additions on the property. | Land | Improvement |
|---|---|---|---|---|
| 2025 | $16,136 | $1,456,560 | $1,282,380 | $174,180 |
| 2024 | $16,136 | $1,428,000 | $1,257,235 | $170,765 |
| 2023 | $11,562 | $1,023,571 | $862,215 | $161,356 |
| 2022 | $11,259 | $1,003,501 | $845,308 | $158,193 |
| 2021 | $11,048 | $983,825 | $828,733 | $155,092 |
| 2020 | $10,977 | $973,738 | $820,236 | $153,502 |
| 2019 | $10,843 | $954,646 | $804,153 | $150,493 |
| 2018 | $10,674 | $935,928 | $788,385 | $147,543 |
| 2017 | $10,532 | $917,577 | $772,927 | $144,650 |
| 2016 | $10,074 | $894,000 | $757,772 | $136,228 |
| 2015 | $9,491 | $836,000 | $706,000 | $130,000 |
| 2014 | $9,473 | $836,000 | $706,000 | $130,000 |
Source: Public Records
Map
Nearby Homes
- 304 18th St
- 412 20th St
- 306 17th St
- 2000 Pacific Coast Hwy Unit 313
- 2000 Pacific Coast Hwy Unit 103
- 2000 Pacific Coast Hwy Unit 309
- 125 16th St
- 419 18th St
- 1516 Pacific Coast Hwy Unit 101
- 505 17th St
- 521 18th St
- 304 Goldenwest St
- 411 22nd St
- 1400 Pacific Coast Hwy Unit 305
- 319 14th St Unit B
- 416 15th St
- 413 14th St Unit D
- 627 19th St
- 620 22nd St
- 1200 Pacific Coast Hwy Unit 102