Estimated Value: $248,000 - $289,000
3
Beds
3
Baths
2,389
Sq Ft
$115/Sq Ft
Est. Value
About This Home
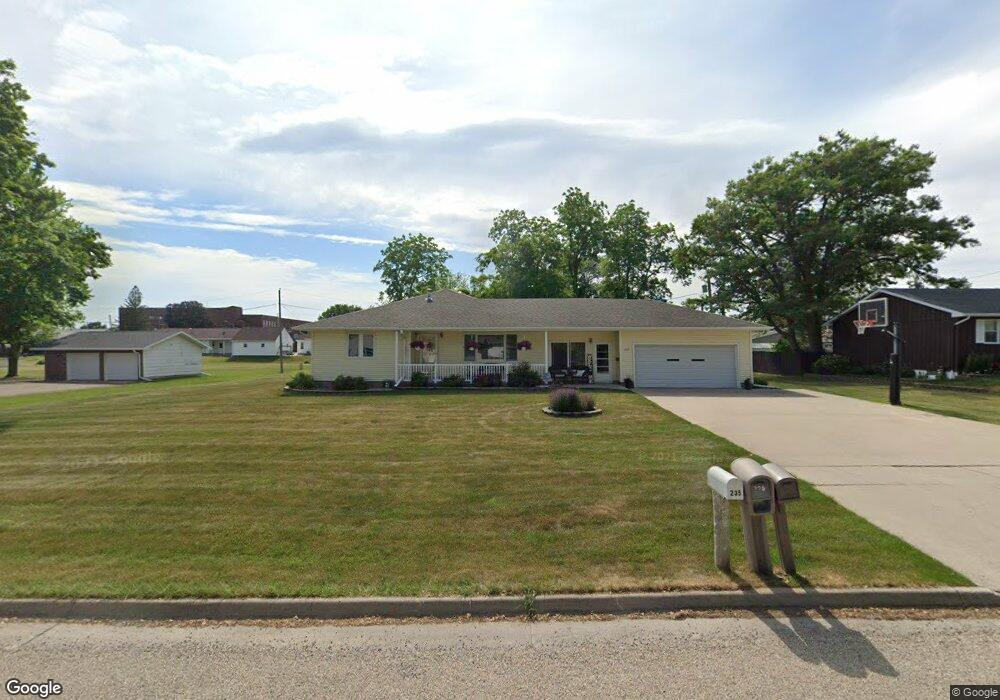
This home is located at 224 7th St, Jesup, IA 50648 and is currently estimated at $275,201, approximately $115 per square foot. 224 7th St is a home located in Buchanan County with nearby schools including Jesup Elementary School, Jesup Middle School, and Jesup High School.
Ownership History
Date
Name
Owned For
Owner Type
Purchase Details
Closed on
Dec 30, 2011
Sold by
Barnett Robert O and Barnett Kelly K
Bought by
Youngblut Troy Raphael and Youngblut Marie E
Current Estimated Value
Home Financials for this Owner
Home Financials are based on the most recent Mortgage that was taken out on this home.
Original Mortgage
$145,600
Interest Rate
3.99%
Mortgage Type
New Conventional
Create a Home Valuation Report for This Property
The Home Valuation Report is an in-depth analysis detailing your home's value as well as a comparison with similar homes in the area
Home Values in the Area
Average Home Value in this Area
Purchase History
| Date | Buyer | Sale Price | Title Company |
|---|---|---|---|
| Youngblut Troy Raphael | $182,000 | None Available |
Source: Public Records
Mortgage History
| Date | Status | Borrower | Loan Amount |
|---|---|---|---|
| Previous Owner | Youngblut Troy Raphael | $145,600 |
Source: Public Records
Tax History
| Year | Tax Paid | Tax Assessment Tax Assessment Total Assessment is a certain percentage of the fair market value that is determined by local assessors to be the total taxable value of land and additions on the property. | Land | Improvement |
|---|---|---|---|---|
| 2025 | $4,198 | $274,110 | $41,530 | $232,580 |
| 2024 | $4,198 | $239,630 | $37,080 | $202,550 |
| 2023 | $4,070 | $239,630 | $37,080 | $202,550 |
| 2022 | $3,726 | $192,580 | $29,430 | $163,150 |
| 2021 | $3,674 | $192,580 | $29,430 | $163,150 |
| 2020 | $3,674 | $179,490 | $26,980 | $152,510 |
| 2019 | $3,580 | $179,490 | $26,980 | $152,510 |
| 2018 | $3,392 | $174,380 | $26,980 | $147,400 |
| 2017 | $3,168 | $174,380 | $26,980 | $147,400 |
| 2016 | $3,092 | $160,510 | $18,240 | $142,270 |
| 2015 | $3,092 | $160,510 | $18,240 | $142,270 |
| 2014 | $3,142 | $160,510 | $18,240 | $142,270 |
Source: Public Records
Map
Nearby Homes
- 814 Duroe St
- 1089 210th St
- 414 Main St
- 625 6th St
- 915 Young St
- 524 Christopher Cir
- 1245 Hawley St
- 764 Stevens St
- 945 2nd St
- 1155 8th St
- 1124 3rd St
- 1225 1st St
- 0 220th St
- 1217 220th St
- 1209 220th St
- Lot 4 Benson Shady Grove Ave
- Lot 2 Benson Shady Grove Ave
- Lot 1 Benson Shady Grove Ave
- 0 Benson Ridge Addition Unit Lot 7
- 0 Benson Ridge Addition Unit Lot 1