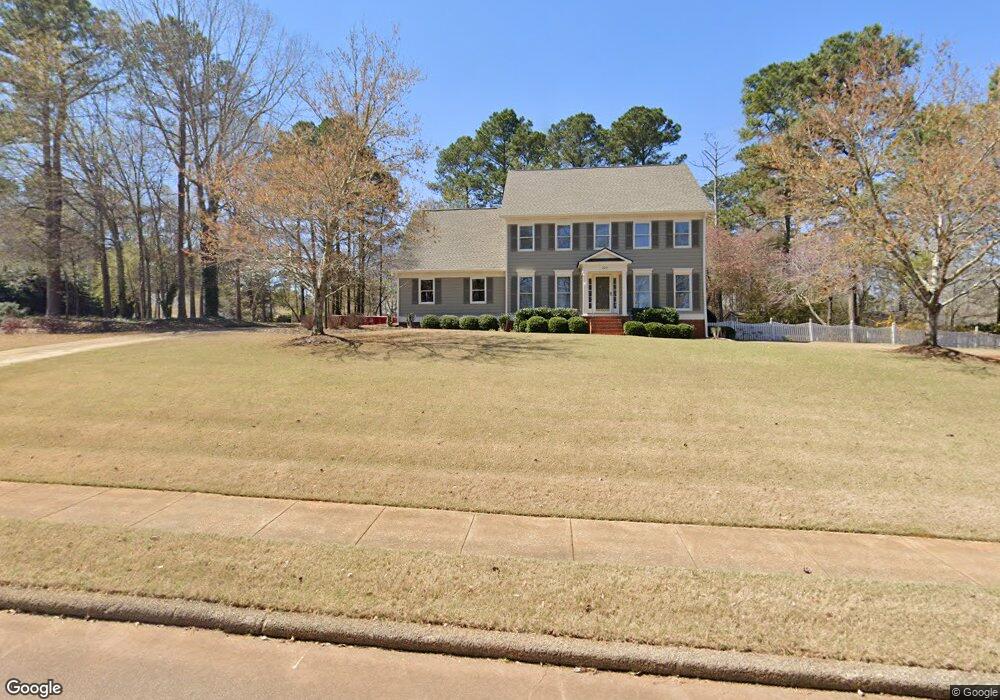
224 Ashford Cir Lagrange, GA 30240
Estimated Value: $398,000 - $668,000
4
Beds
4
Baths
3,905
Sq Ft
$132/Sq Ft
Est. Value
About This Home
This home is located at 224 Ashford Cir, Lagrange, GA 30240 and is currently estimated at $515,102, approximately $131 per square foot. 224 Ashford Cir is a home located in Troup County with nearby schools including Franklin Forest Elementary School, Hollis Hand Elementary School, and Ethel W. Kight Elementary School.
Ownership History
Date
Name
Owned For
Owner Type
Purchase Details
Closed on
May 24, 2016
Sold by
Rutter Stephen J
Bought by
Thompson Roderick Merrill and Thompson Karin
Current Estimated Value
Home Financials for this Owner
Home Financials are based on the most recent Mortgage that was taken out on this home.
Original Mortgage
$229,600
Outstanding Balance
$182,778
Interest Rate
3.66%
Mortgage Type
New Conventional
Estimated Equity
$332,324
Purchase Details
Closed on
Dec 5, 2002
Sold by
Stephen J Rutter Interest
Bought by
Rutter Stephen J and Rutter Lesia W
Purchase Details
Closed on
Oct 20, 2000
Sold by
Velva M Rutter
Bought by
Stephen J Rutter Interest
Purchase Details
Closed on
Jul 1, 1991
Sold by
Stacey Lonnie and Stacey Braxton
Bought by
Velva M Rutter
Purchase Details
Closed on
Feb 1, 1989
Sold by
West Ga Estates Inc
Bought by
Stacey Lonnie and Stacey Braxton
Purchase Details
Closed on
Jun 14, 1985
Sold by
Heinrich J Boggess
Bought by
West Ga Estates Inc
Create a Home Valuation Report for This Property
The Home Valuation Report is an in-depth analysis detailing your home's value as well as a comparison with similar homes in the area
Home Values in the Area
Average Home Value in this Area
Purchase History
| Date | Buyer | Sale Price | Title Company |
|---|---|---|---|
| Thompson Roderick Merrill | $287,000 | -- | |
| Rutter Stephen J | -- | -- | |
| Stephen J Rutter Interest | -- | -- | |
| Velva M Rutter | $25,000 | -- | |
| Stacey Lonnie | $29,000 | -- | |
| West Ga Estates Inc | -- | -- |
Source: Public Records
Mortgage History
| Date | Status | Borrower | Loan Amount |
|---|---|---|---|
| Open | Thompson Roderick Merrill | $229,600 |
Source: Public Records
Tax History Compared to Growth
Tax History
| Year | Tax Paid | Tax Assessment Tax Assessment Total Assessment is a certain percentage of the fair market value that is determined by local assessors to be the total taxable value of land and additions on the property. | Land | Improvement |
|---|---|---|---|---|
| 2024 | $4,387 | $160,840 | $18,000 | $142,840 |
| 2023 | $4,116 | $150,920 | $14,000 | $136,920 |
| 2022 | $3,783 | $135,560 | $14,000 | $121,560 |
| 2021 | $3,692 | $122,400 | $14,000 | $108,400 |
| 2020 | $3,692 | $122,400 | $14,000 | $108,400 |
| 2019 | $3,459 | $114,680 | $14,000 | $100,680 |
| 2018 | $3,459 | $114,680 | $14,000 | $100,680 |
| 2017 | $3,459 | $114,680 | $14,000 | $100,680 |
| 2016 | $3,476 | $117,229 | $14,000 | $103,229 |
| 2015 | $3,482 | $117,229 | $14,000 | $103,229 |
| 2014 | $3,323 | $111,796 | $14,000 | $97,796 |
| 2013 | -- | $114,135 | $13,300 | $100,835 |
Source: Public Records
Map
Nearby Homes
- 118 Moss Creek Dr
- 104 Hidden Branches Ln
- 127 Oakmont Dr
- LOT 106 River Oaks Dr
- 107 Windridge
- 109 Windridge
- 105 Ridgeview Dr
- 209 River Oaks Dr
- 117 Woodchase
- 127 Ashling Dr
- 129 Sunny Point Cir
- 91 Richmond Dr
- 1784 New Franklin Rd
- 100 Creekside Dr Unit LOT 60A
- 107 Dixie Creek Dr
- 89 Chase Rd
- 106 S Chilton Crescent
- 203 S Chilton Crescent
- 201 S Chilton Crescent
- 106 Highland Park
- 100 Saint Angela Merici Ct
- 222 Ashford Cir
- 229 Ashford Cir
- 233 Ashford Cir
- 230 Ashford Cir
- 220 Ashford Cir
- 227 Ashford Cir
- 102 Saint Angela Merici Ct
- 101 Saint Angela Merici Ct
- 218 Ashford Cir
- 225 Ashford Cir
- 223 Ashford Cir
- 308 Ashford Cir
- 104 St Angela Merici
- 104 Saint Angela Merici Ct
- 235 Ashford Cir
- 103 Saint Angela Merici Ct
- 221 Ashford Cir
- 216 Ashford Cir
- 219 Ashford Cir