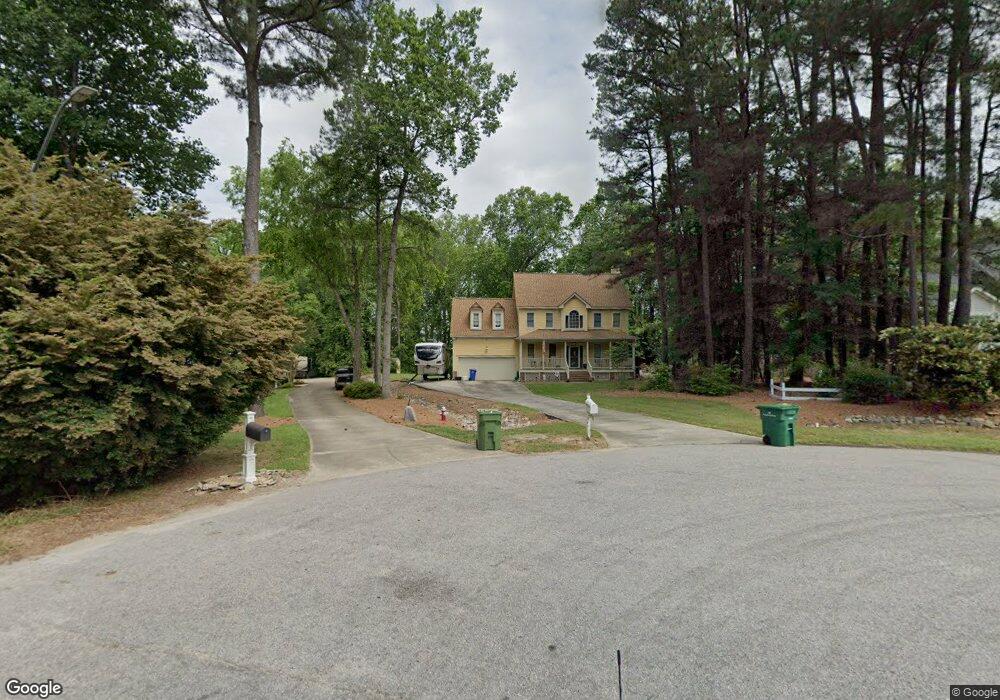
224 Birch Creek Dr Fuquay Varina, NC 27526
Estimated Value: $503,000 - $568,000
--
Bed
3
Baths
2,196
Sq Ft
$240/Sq Ft
Est. Value
About This Home
This home is located at 224 Birch Creek Dr, Fuquay Varina, NC 27526 and is currently estimated at $526,398, approximately $239 per square foot. 224 Birch Creek Dr is a home located in Wake County with nearby schools including Fuquay-Varina High, Southern Wake Academy, and New School Montessori Center.
Ownership History
Date
Name
Owned For
Owner Type
Purchase Details
Closed on
Apr 8, 2025
Sold by
Demuinck Paul F and Demuinck Angela M
Bought by
De Muinck Family Revocable Trust and De Muinck
Current Estimated Value
Purchase Details
Closed on
Aug 18, 2006
Sold by
Demuinck Paul F
Bought by
Demuinck Paul F and Demuinck Angela M
Home Financials for this Owner
Home Financials are based on the most recent Mortgage that was taken out on this home.
Original Mortgage
$154,000
Interest Rate
6.73%
Mortgage Type
Purchase Money Mortgage
Purchase Details
Closed on
Nov 30, 2001
Sold by
Demuinck Shannon B
Bought by
Demuinck Paul F
Home Financials for this Owner
Home Financials are based on the most recent Mortgage that was taken out on this home.
Original Mortgage
$161,000
Interest Rate
6.37%
Purchase Details
Closed on
Aug 28, 1997
Bought by
Demuinck Paul F and Demuinck Angela M
Create a Home Valuation Report for This Property
The Home Valuation Report is an in-depth analysis detailing your home's value as well as a comparison with similar homes in the area
Home Values in the Area
Average Home Value in this Area
Purchase History
| Date | Buyer | Sale Price | Title Company |
|---|---|---|---|
| De Muinck Family Revocable Trust | -- | None Listed On Document | |
| Demuinck Paul F | -- | None Available | |
| Demuinck Paul F | -- | -- | |
| Demuinck Paul F | $179,000 | -- |
Source: Public Records
Mortgage History
| Date | Status | Borrower | Loan Amount |
|---|---|---|---|
| Previous Owner | Demuinck Paul F | $154,000 | |
| Previous Owner | Demuinck Paul F | $161,000 |
Source: Public Records
Tax History Compared to Growth
Tax History
| Year | Tax Paid | Tax Assessment Tax Assessment Total Assessment is a certain percentage of the fair market value that is determined by local assessors to be the total taxable value of land and additions on the property. | Land | Improvement |
|---|---|---|---|---|
| 2025 | $4,161 | $473,168 | $110,000 | $363,168 |
| 2024 | $4,144 | $473,168 | $110,000 | $363,168 |
| 2023 | $3,205 | $286,459 | $52,000 | $234,459 |
| 2022 | $3,012 | $286,459 | $52,000 | $234,459 |
| 2021 | $2,870 | $286,459 | $52,000 | $234,459 |
| 2020 | $2,870 | $286,459 | $52,000 | $234,459 |
| 2019 | $2,772 | $238,613 | $52,000 | $186,613 |
| 2018 | $2,613 | $238,613 | $52,000 | $186,613 |
| 2017 | $2,519 | $238,613 | $52,000 | $186,613 |
| 2016 | $2,485 | $238,613 | $52,000 | $186,613 |
| 2015 | $2,326 | $230,746 | $52,000 | $178,746 |
| 2014 | -- | $230,746 | $52,000 | $178,746 |
Source: Public Records
Map
Nearby Homes
- 305 Dickens Rd
- 219 Dickens Rd
- 2045 Herbert Akins Rd
- 119 Riding Ridge Rd
- 109 Hammermill Dr
- 2387 Herbert Akins Rd
- 176 Breezemont Dr
- 614 Andrade Dr
- 1894 Landstrom Ln
- 516 Culmore Dr
- 121 Stone Nut Trail
- 2406 Belvinwood Dr
- 139 Stone Nut Trail
- 2425 Glade Mill Ct
- 712 Andrade Dr
- 2214 Sugar Cone Way
- 752 Westec Way
- 2507 Belvinwood Dr
- 151 Stobhill Ln
- 316 Edgecroft Way
- 220 Birch Creek Dr
- 225 Birch Creek Dr
- 216 Birch Creek Dr
- 221 Birch Creek Dr
- 212 Birch Creek Dr
- 217 Birch Creek Dr
- 209 Birch Creek Dr
- 208 Birch Creek Dr
- 912 Magnolia Ridge Way
- 2005 Herbert Akins Rd
- 916 Magnolia Ridge Way
- 908 Magnolia Ridge Way
- 920 Magnolia Ridge Way
- 205 Birch Creek Dr
- 204 Birch Creek Dr
- 2025 Herbert Akins Rd
- 904 Magnolia Ridge Way
- 301 Dickens Rd
- 2025 Herbert Akins Rd
- 309 Dickens Rd