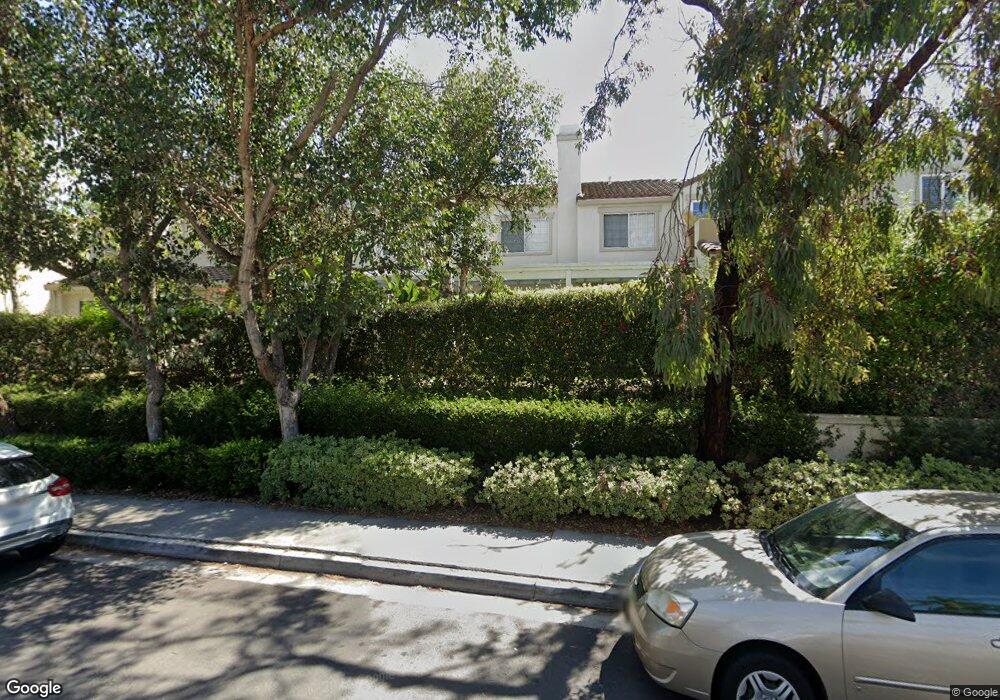
224 Chandon Unit 3 Laguna Niguel, CA 92677
Marina Hills NeighborhoodEstimated Value: $742,283 - $800,000
2
Beds
2
Baths
1,078
Sq Ft
$711/Sq Ft
Est. Value
About This Home
This home is located at 224 Chandon Unit 3, Laguna Niguel, CA 92677 and is currently estimated at $766,571, approximately $711 per square foot. 224 Chandon Unit 3 is a home located in Orange County with nearby schools including George White Elementary, Niguel Hills Middle School, and Dana Hills High School.
Ownership History
Date
Name
Owned For
Owner Type
Purchase Details
Closed on
May 12, 2022
Sold by
Dickson Beverly A
Bought by
Beverly A Dickson Living Trust and Dickson
Current Estimated Value
Purchase Details
Closed on
Jul 1, 1998
Sold by
Fielder Carl F
Bought by
Dickson Beverly A
Home Financials for this Owner
Home Financials are based on the most recent Mortgage that was taken out on this home.
Original Mortgage
$137,600
Interest Rate
6.88%
Create a Home Valuation Report for This Property
The Home Valuation Report is an in-depth analysis detailing your home's value as well as a comparison with similar homes in the area
Home Values in the Area
Average Home Value in this Area
Purchase History
| Date | Buyer | Sale Price | Title Company |
|---|---|---|---|
| Beverly A Dickson Living Trust | -- | Blik Fay | |
| Dickson Beverly A | $172,000 | Fidelity National Title Ins |
Source: Public Records
Mortgage History
| Date | Status | Borrower | Loan Amount |
|---|---|---|---|
| Previous Owner | Dickson Beverly A | $137,600 |
Source: Public Records
Tax History Compared to Growth
Tax History
| Year | Tax Paid | Tax Assessment Tax Assessment Total Assessment is a certain percentage of the fair market value that is determined by local assessors to be the total taxable value of land and additions on the property. | Land | Improvement |
|---|---|---|---|---|
| 2025 | $2,619 | $269,633 | $114,669 | $154,964 |
| 2024 | $2,619 | $264,347 | $112,421 | $151,926 |
| 2023 | $2,562 | $259,164 | $110,216 | $148,948 |
| 2022 | $2,512 | $254,083 | $108,055 | $146,028 |
| 2021 | $2,462 | $249,101 | $105,936 | $143,165 |
| 2020 | $2,437 | $246,547 | $104,849 | $141,698 |
| 2019 | $2,388 | $241,713 | $102,793 | $138,920 |
| 2018 | $2,341 | $236,974 | $100,777 | $136,197 |
| 2017 | $2,294 | $232,328 | $98,801 | $133,527 |
| 2016 | $2,249 | $227,773 | $96,864 | $130,909 |
| 2015 | $2,214 | $224,352 | $95,409 | $128,943 |
| 2014 | $2,170 | $219,958 | $93,540 | $126,418 |
Source: Public Records
Map
Nearby Homes