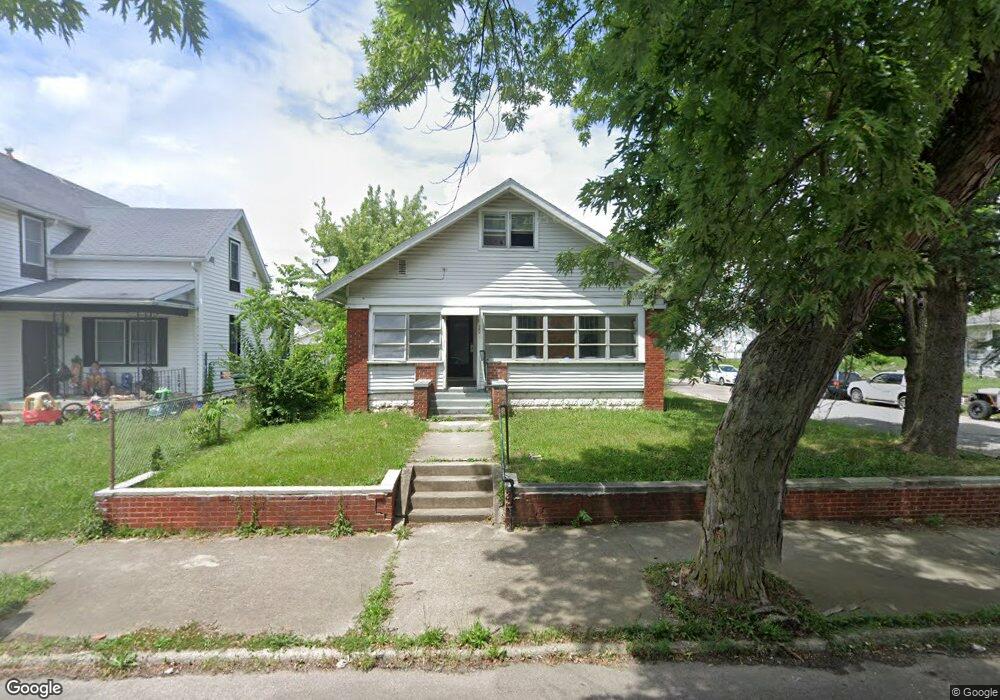
224 E 13th St Muncie, IN 47302
Southside NeighborhoodEstimated Value: $87,000 - $99,000
3
Beds
1
Bath
2,324
Sq Ft
$40/Sq Ft
Est. Value
About This Home
This home is located at 224 E 13th St, Muncie, IN 47302 and is currently estimated at $92,915, approximately $39 per square foot. 224 E 13th St is a home located in Delaware County with nearby schools including South View Elementary School, Muncie Central High School, and Southside Middle School.
Ownership History
Date
Name
Owned For
Owner Type
Purchase Details
Closed on
Apr 9, 2024
Sold by
Clients Farm Llc
Bought by
Rwa Properties Llc
Current Estimated Value
Purchase Details
Closed on
May 13, 2022
Sold by
Wilson Proper Llc
Bought by
Clients Farm Llc
Home Financials for this Owner
Home Financials are based on the most recent Mortgage that was taken out on this home.
Original Mortgage
$418,312
Interest Rate
4.72%
Mortgage Type
Construction
Purchase Details
Closed on
Feb 21, 2008
Sold by
Nationstar Mortgage Llc
Bought by
Criswell Paul
Purchase Details
Closed on
Sep 28, 2007
Sold by
Norris Robert
Bought by
Nationstar Mortgage Llc
Create a Home Valuation Report for This Property
The Home Valuation Report is an in-depth analysis detailing your home's value as well as a comparison with similar homes in the area
Home Values in the Area
Average Home Value in this Area
Purchase History
| Date | Buyer | Sale Price | Title Company |
|---|---|---|---|
| Rwa Properties Llc | -- | None Listed On Document | |
| Clients Farm Llc | $557,750 | Itic | |
| Wilson Proper Llc | -- | Itic | |
| Criswell Paul | -- | Resource Title Of Cincinnati | |
| Nationstar Mortgage Llc | $60,000 | None Available |
Source: Public Records
Mortgage History
| Date | Status | Borrower | Loan Amount |
|---|---|---|---|
| Previous Owner | Wilson Proper Llc | $418,312 |
Source: Public Records
Tax History
| Year | Tax Paid | Tax Assessment Tax Assessment Total Assessment is a certain percentage of the fair market value that is determined by local assessors to be the total taxable value of land and additions on the property. | Land | Improvement |
|---|---|---|---|---|
| 2025 | $1,114 | $50,300 | $5,700 | $44,600 |
| 2024 | $1,189 | $51,200 | $5,700 | $45,500 |
| 2023 | $962 | $42,700 | $4,800 | $37,900 |
| 2022 | $970 | $43,100 | $4,800 | $38,300 |
| 2021 | $978 | $43,500 | $5,400 | $38,100 |
| 2020 | $922 | $40,700 | $5,400 | $35,300 |
| 2019 | $922 | $40,700 | $5,400 | $35,300 |
| 2018 | $1,034 | $46,300 | $6,000 | $40,300 |
| 2017 | $1,034 | $46,300 | $6,600 | $39,700 |
| 2016 | $1,034 | $46,300 | $6,600 | $39,700 |
| 2014 | $1,053 | $50,500 | $7,400 | $43,100 |
| 2013 | -- | $50,000 | $7,400 | $42,600 |
Source: Public Records
Map
Nearby Homes
- 2004 S Walnut St
- 1801 S Jefferson St
- 1715 S Madison St
- 1700 S Walnut St
- 2205 S Vine St
- 313 W 10th St
- 2101 S Pershing Dr
- 2408 S Mulberry St
- 808 E 13th St
- 1921 S Hackley St
- 309 W 8th St
- 500 W Memorial Dr
- 1505 S Vine St
- 617 W Memorial Dr
- 2117 S Beacon St
- 1303 S Liberty St
- 2314 S Ebright St
- 2411 S Ebright St
- 805 W 15th St
- 2007 S Penn St
- 216 E 13th St
- 214 E 13th St
- 300 E 13th St
- 1903 S Jefferson St
- 212 E 13th St
- 302 E 13th St
- 217 E Memorial Dr
- 215 E Memorial Dr
- 225 E Memorial Dr
- 301 E Memorial Dr
- 301 E Memorial Dr Unit 303
- 2000 S Jefferson St
- 2003 S Jefferson St
- 210 E 13th St
- 308 E 13th St
- 213 E Memorial Dr
- 305 E Memorial Dr
- 2005 S Jefferson St
- 2006 S Jefferson St
- 205 E Memorial Dr
Your Personal Tour Guide
Ask me questions while you tour the home.