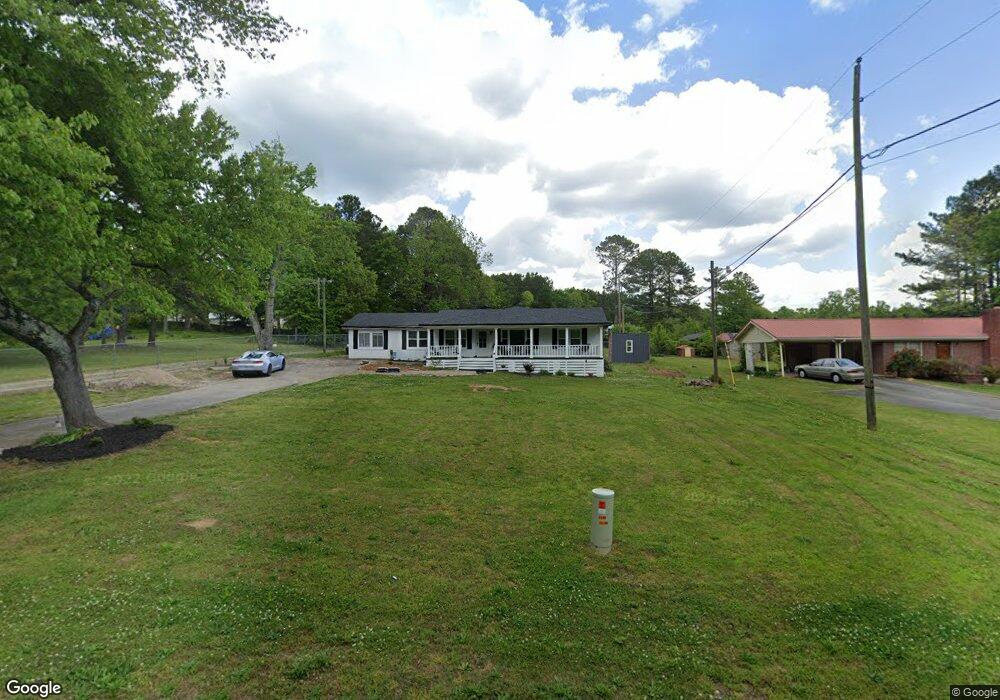
224 E Wright St Winder, GA 30680
Estimated Value: $210,000 - $400,000
5
Beds
2
Baths
2,354
Sq Ft
$139/Sq Ft
Est. Value
About This Home
This home is located at 224 E Wright St, Winder, GA 30680 and is currently estimated at $326,254, approximately $138 per square foot. 224 E Wright St is a home located in Barrow County with nearby schools including Holsenbeck Elementary School, Bear Creek Middle School, and Winder-Barrow High School.
Ownership History
Date
Name
Owned For
Owner Type
Purchase Details
Closed on
Jul 8, 2022
Sold by
Hosch Lenon
Bought by
Hosch Alexandrea Lynn and Parks Jason Reid
Current Estimated Value
Purchase Details
Closed on
Mar 20, 2020
Sold by
Weatherford Waylon
Bought by
Hosch Lenon and Hosch Terry
Purchase Details
Closed on
Oct 2, 2003
Sold by
Weatherford Tammy H
Bought by
Weatherford Tammy H and Weatherford Waylon
Home Financials for this Owner
Home Financials are based on the most recent Mortgage that was taken out on this home.
Original Mortgage
$95,000
Interest Rate
6.45%
Mortgage Type
Stand Alone Second
Create a Home Valuation Report for This Property
The Home Valuation Report is an in-depth analysis detailing your home's value as well as a comparison with similar homes in the area
Home Values in the Area
Average Home Value in this Area
Purchase History
| Date | Buyer | Sale Price | Title Company |
|---|---|---|---|
| Hosch Alexandrea Lynn | $400,000 | -- | |
| Hosch Lenon | $85,000 | -- | |
| Weatherford Tammy H | -- | -- |
Source: Public Records
Mortgage History
| Date | Status | Borrower | Loan Amount |
|---|---|---|---|
| Previous Owner | Weatherford Tammy H | $95,000 |
Source: Public Records
Tax History
| Year | Tax Paid | Tax Assessment Tax Assessment Total Assessment is a certain percentage of the fair market value that is determined by local assessors to be the total taxable value of land and additions on the property. | Land | Improvement |
|---|---|---|---|---|
| 2025 | $1,823 | $78,995 | $20,000 | $58,995 |
| 2024 | $1,802 | $75,572 | $18,000 | $57,572 |
| 2023 | $1,866 | $75,572 | $18,000 | $57,572 |
| 2022 | $1,347 | $46,441 | $10,000 | $36,441 |
| 2021 | $1,048 | $46,441 | $10,000 | $36,441 |
| 2020 | $1,423 | $46,441 | $10,000 | $36,441 |
| 2019 | $1,305 | $41,728 | $10,000 | $31,728 |
| 2018 | $1,286 | $41,728 | $10,000 | $31,728 |
| 2017 | $1,112 | $38,200 | $10,000 | $28,200 |
| 2016 | $1,452 | $47,560 | $10,000 | $37,560 |
| 2015 | $1,459 | $47,560 | $10,000 | $37,560 |
| 2014 | $1,349 | $42,460 | $4,900 | $37,560 |
| 2013 | -- | $40,124 | $4,900 | $35,224 |
Source: Public Records
Map
Nearby Homes
- 252 Eastbrook Dr
- 337 Mary Alice Dr
- 163 Wood Cir
- 39 Huckleberry Ln
- 92 Chase Cir
- 31 Huckleberry Ln
- 208 Shields St
- 227 Martin Luther King jr Dr
- 184 Capitol Ave
- 295 E Wright St
- 0 E Midland Ave Unit 7743047
- 267 Griffith St
- 72 Shoal Ct
- 76 Shoal Ct
- 78 Shoal Ct
- 80 Shoal Ct
- 74 Shoal Ct
- 260 Westlyn Way
- 154 Blake Ln
- 414 Grayson Dr
- 228 E Wright St
- 0 E Wright St
- 218 E Wright St
- 218 E Wright St
- 205 Eastbrook Dr
- 206 Eastbrook Dr
- 420 Harpy Eagle Dr
- 422 Harpy Eagle Dr
- 309 Dreamland Ct
- 311 Dreamland Ct
- 307 Dreamland Ct Unit 2
- 313 Dreamland Ct
- 418 Harpy Eagle Dr
- 233 E Wright St
- 305 Dreamland Ct Unit 2
- 305 Dreamland Ct
- 209 Eastbrook Dr
- 416 Harpy Eagle Dr
- 416 Harpy Eagle Dr
- 317 Dreamland Ct
Your Personal Tour Guide
Ask me questions while you tour the home.