P
Landlord's Agent in 2025
Pierre Gendebien
Realty ONE Group, Inc
(702) 326-2333
109 Total Sales
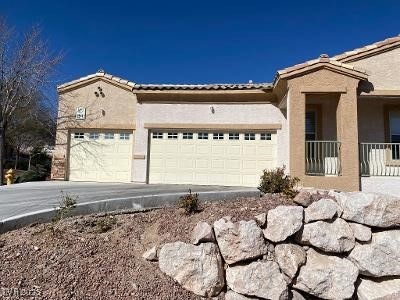
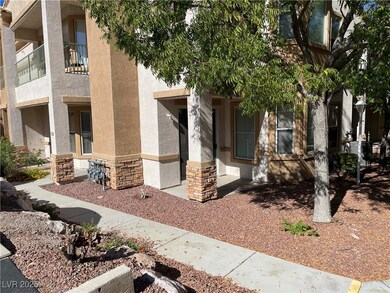
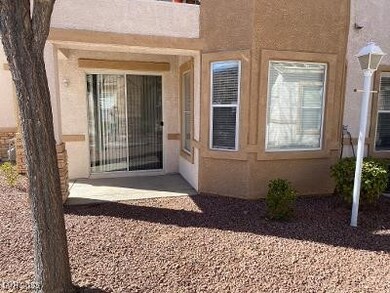
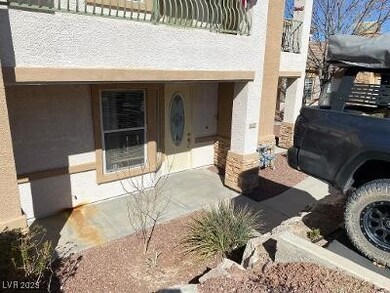
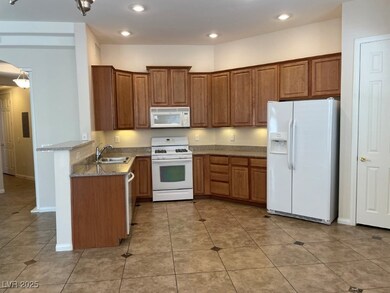

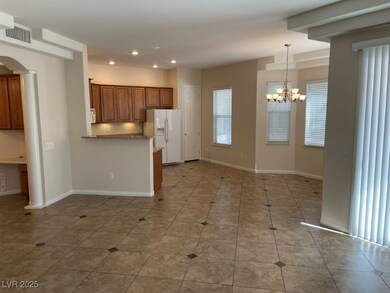
ONE STORY END UNIT 2 BEDROOM/2BATH CONDO W/ATTACHED 2 CAR GARAGE. GRANITE COUNTERTOPS, TILE FLOORS THROUGHOUT W/CARPET IN BEDROOMS. BUILT IN DESK, FIREPLACE, PATIOS, CEILING FANS IN ALL ROOMS, ALL APPLIANCES INCLUDED & ALL MINUTES FROM FABULOUS LAKE MEAD / BOULDER CITY !! COMMUNITY OFFERS CLUBHOUSE, POOL/SPA, EXERCISE...WOW!
Last Agent to Rent the Property
Realty ONE Group, Inc Brokerage Phone: (702) 326-2333 License #S.0053080 Listed on: 02/13/2025

Last Renter's Agent
Realty ONE Group, Inc Brokerage Phone: (702) 326-2333 License #S.0053080 Listed on: 02/13/2025
Home Type
Est. Annual Taxes
Year Built
Lot Details
Parking
Home Design
Interior Spaces
Kitchen
Flooring
Bedrooms and Bathrooms
Laundry
Schools
Utilities
Listing and Financial Details
Overview
Amenities
Recreation
Pet Policy
| Date | Buyer | Sale Price | Title Company |
|---|---|---|---|
| Herinckx Michael Lawrence | -- | None Available | |
| Herinckx Michael | $229,999 | Chicago Title |
| Date | Status | Borrower | Loan Amount |
|---|---|---|---|
| Open | Herinckx Michael | $199,975 | |
| Closed | Herinckx Michael | $218,450 |
| Date | Event | Price | Change | Sq Ft Price |
|---|---|---|---|---|
| 04/23/2025 04/23/25 | Rented | $1,750 | 0.0% | -- |
| 04/18/2025 04/18/25 | Under Contract | -- | -- | -- |
| 03/19/2025 03/19/25 | Price Changed | $1,750 | -2.8% | $1 / Sq Ft |
| 03/03/2025 03/03/25 | Price Changed | $1,800 | -4.0% | $1 / Sq Ft |
| 02/13/2025 02/13/25 | For Rent | $1,875 | +7.1% | -- |
| 10/18/2022 10/18/22 | Rented | $1,750 | 0.0% | -- |
| 09/09/2022 09/09/22 | For Rent | $1,750 | +35.1% | -- |
| 10/15/2020 10/15/20 | Rented | $1,295 | 0.0% | -- |
| 09/15/2020 09/15/20 | Under Contract | -- | -- | -- |
| 09/14/2020 09/14/20 | For Rent | $1,295 | +18.3% | -- |
| 05/31/2017 05/31/17 | Rented | $1,095 | -12.4% | -- |
| 05/01/2017 05/01/17 | Under Contract | -- | -- | -- |
| 04/27/2017 04/27/17 | For Rent | $1,250 | 0.0% | -- |
| 03/24/2016 03/24/16 | For Rent | $1,250 | 0.0% | -- |
| 03/24/2016 03/24/16 | Rented | $1,250 | -- | -- |
| Year | Tax Paid | Tax Assessment Tax Assessment Total Assessment is a certain percentage of the fair market value that is determined by local assessors to be the total taxable value of land and additions on the property. | Land | Improvement |
|---|---|---|---|---|
| 2025 | $1,686 | $102,837 | $36,400 | $66,437 |
| 2024 | $1,561 | $102,837 | $36,400 | $66,437 |
| 2023 | $1,561 | $96,322 | $35,350 | $60,972 |
| 2022 | $1,446 | $87,000 | $30,450 | $56,550 |
| 2021 | $1,339 | $80,840 | $26,600 | $54,240 |
| 2020 | $1,242 | $78,224 | $24,150 | $54,074 |
| 2019 | $1,164 | $77,872 | $24,150 | $53,722 |
| 2018 | $1,110 | $63,191 | $13,650 | $49,541 |
| 2017 | $1,493 | $57,190 | $13,650 | $43,540 |
| 2016 | $1,039 | $53,196 | $9,800 | $43,396 |
| 2015 | $1,036 | $41,395 | $8,750 | $32,645 |
| 2014 | $1,006 | $37,713 | $10,500 | $27,213 |
P
Landlord's Agent in 2025
Pierre Gendebien
Realty ONE Group, Inc
(702) 326-2333
109 Total Sales
L
Buyer's Agent in 2022
Lucia Cabaud
Local Realty
(725) 600-2879
10 Total Sales
J
Buyer's Agent in 2017
Julia Suarez
United Realty Group
(702) 285-7199
33 Total Sales
Source: Las Vegas REALTORS®
MLS Number: 2656073
APN: 186-04-516-077
Disclaimer: Certain information contained herein is derived from information provided by parties other than Homes.com. All information provided is deemed reliable, but is not guaranteed to be accurate and should be independently verified.
![]() The data relating to real estate for sale on this web site comes in part from the INTERNET DATA EXCHANGE Program of the Greater Las Vegas Association of REALTORS® MLS. Real estate listings held by brokerage firms other than this site owner are marked with the IDX logo. Information is deemed reliable but not guaranteed. Copyright 2025 of the Greater Las Vegas Association of REALTORS® MLS. All rights reserved.
The data relating to real estate for sale on this web site comes in part from the INTERNET DATA EXCHANGE Program of the Greater Las Vegas Association of REALTORS® MLS. Real estate listings held by brokerage firms other than this site owner are marked with the IDX logo. Information is deemed reliable but not guaranteed. Copyright 2025 of the Greater Las Vegas Association of REALTORS® MLS. All rights reserved.