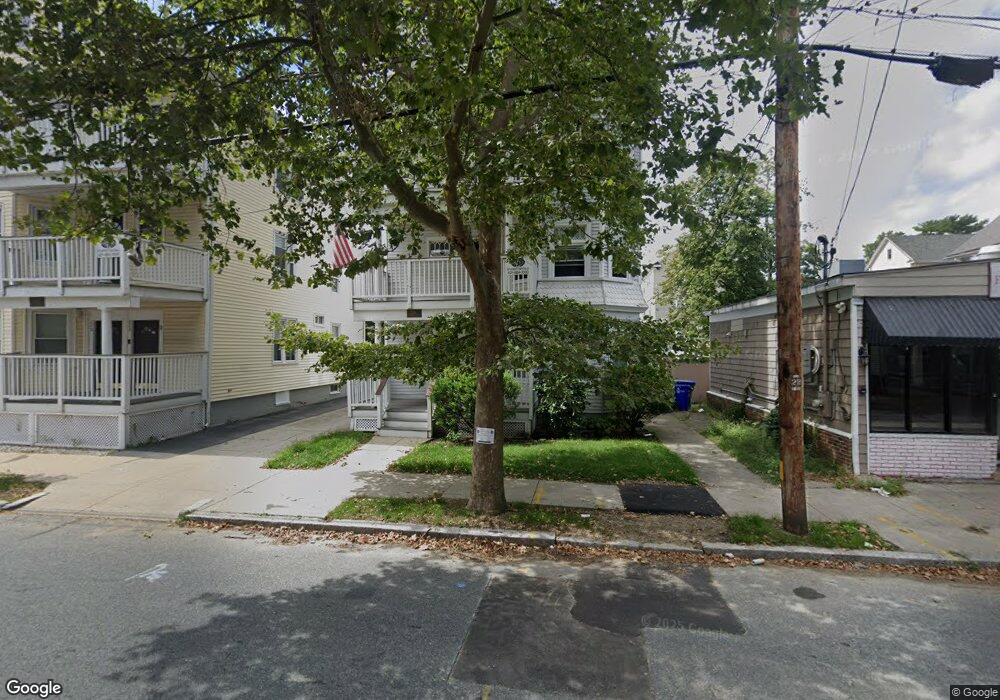
224 Oakland Ave Providence, RI 02908
Elmhurst NeighborhoodEstimated Value: $423,839 - $737,000
6
Beds
3
Baths
2,898
Sq Ft
$206/Sq Ft
Est. Value
About This Home
This home is located at 224 Oakland Ave, Providence, RI 02908 and is currently estimated at $597,460, approximately $206 per square foot. 224 Oakland Ave is a home located in Providence County with nearby schools including Asa Messer Elementary School, Charles N. Fortes Elementary School, and Veazie Street Elementary School.
Ownership History
Date
Name
Owned For
Owner Type
Purchase Details
Closed on
Dec 20, 2019
Sold by
239-241 Oakland Llc
Bought by
2908 Holdco Llc
Current Estimated Value
Home Financials for this Owner
Home Financials are based on the most recent Mortgage that was taken out on this home.
Original Mortgage
$70,000,000
Outstanding Balance
$61,715,080
Interest Rate
3.6%
Mortgage Type
Stand Alone Refi Refinance Of Original Loan
Estimated Equity
-$61,117,620
Purchase Details
Closed on
Jul 27, 2010
Sold by
Pemboke Pinehurst Llc
Bought by
239-241 Oakland Llc
Purchase Details
Closed on
Mar 7, 2008
Sold by
Ri Primo Equities
Bought by
Pembroke Pinehurst Eat
Home Financials for this Owner
Home Financials are based on the most recent Mortgage that was taken out on this home.
Original Mortgage
$168,800
Interest Rate
5.57%
Mortgage Type
Purchase Money Mortgage
Create a Home Valuation Report for This Property
The Home Valuation Report is an in-depth analysis detailing your home's value as well as a comparison with similar homes in the area
Home Values in the Area
Average Home Value in this Area
Purchase History
| Date | Buyer | Sale Price | Title Company |
|---|---|---|---|
| 2908 Holdco Llc | -- | None Available | |
| 239-241 Oakland Llc | -- | -- | |
| Pembroke Pinehurst Eat | $211,000 | -- |
Source: Public Records
Mortgage History
| Date | Status | Borrower | Loan Amount |
|---|---|---|---|
| Open | 2908 Holdco Llc | $70,000,000 | |
| Previous Owner | Pembroke Pinehurst Eat | $168,800 | |
| Previous Owner | Pembroke Pinehurst Eat | $145,000 |
Source: Public Records
Tax History Compared to Growth
Tax History
| Year | Tax Paid | Tax Assessment Tax Assessment Total Assessment is a certain percentage of the fair market value that is determined by local assessors to be the total taxable value of land and additions on the property. | Land | Improvement |
|---|---|---|---|---|
| 2025 | $9,078 | $648,400 | $144,000 | $504,400 |
| 2024 | $7,628 | $415,700 | $68,000 | $347,700 |
| 2023 | $7,628 | $415,700 | $68,000 | $347,700 |
| 2022 | $7,399 | $415,700 | $68,000 | $347,700 |
| 2021 | $6,543 | $266,400 | $33,600 | $232,800 |
| 2020 | $6,543 | $266,400 | $33,600 | $232,800 |
| 2019 | $6,543 | $266,400 | $33,600 | $232,800 |
| 2018 | $8,019 | $250,900 | $36,000 | $214,900 |
| 2017 | $8,019 | $250,900 | $36,000 | $214,900 |
| 2016 | $8,019 | $250,900 | $36,000 | $214,900 |
| 2015 | $7,904 | $238,800 | $47,100 | $191,700 |
| 2014 | $8,060 | $238,800 | $47,100 | $191,700 |
| 2013 | $8,060 | $238,800 | $47,100 | $191,700 |
Source: Public Records
Map
Nearby Homes
- 220 Oakland Ave
- 216 Oakland Ave
- 232 Oakland Ave
- 147 Pembroke Ave
- 141 Pembroke Ave
- 151 Pembroke Ave
- 212 Oakland Ave
- 137 Pembroke Ave
- 227 Oakland Ave
- 38 Eaton St
- 133 Pembroke Ave
- 223 Oakland Ave
- 34 Eaton St
- 208 Oakland Ave
- 219 Oakland Ave
- 44 Eaton St
- 231 Oakland Ave
- 200 Oakland Ave
- 235 Oakland Ave
- 48 Eaton St