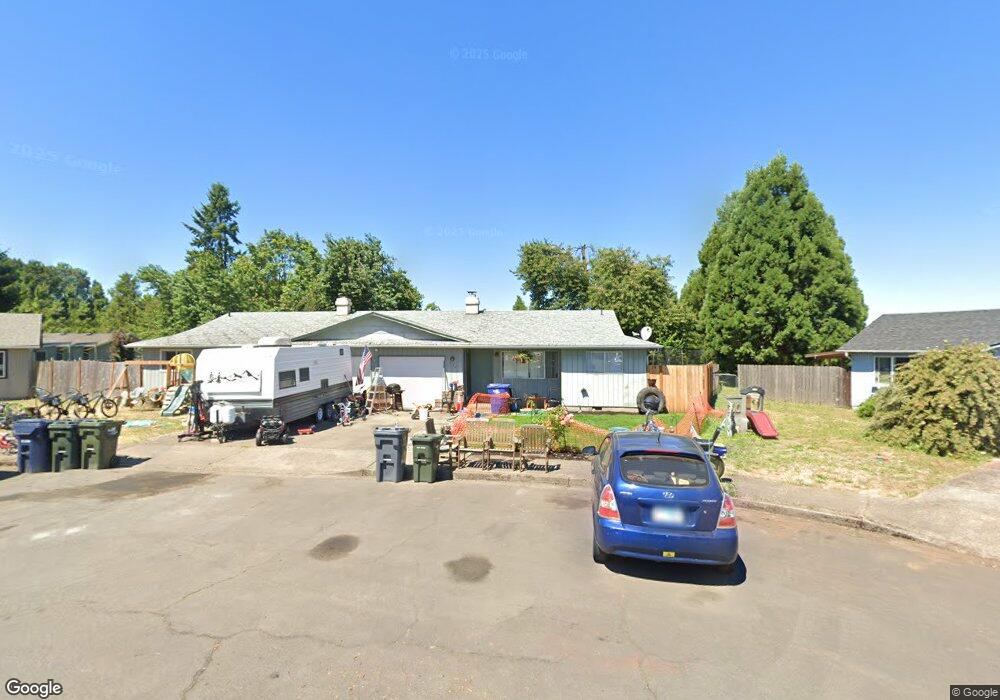
224 S 35th St Springfield, OR 97478
East Springfield NeighborhoodEstimated Value: $407,000 - $464,000
4
Beds
2
Baths
1,648
Sq Ft
$258/Sq Ft
Est. Value
About This Home
This home is located at 224 S 35th St, Springfield, OR 97478 and is currently estimated at $424,755, approximately $257 per square foot. 224 S 35th St is a home located in Lane County with nearby schools including Douglas Gardens Elementary School, Agnes Stewart Middle School, and Springfield High School.
Ownership History
Date
Name
Owned For
Owner Type
Purchase Details
Closed on
Sep 28, 2019
Sold by
Boettcher Brett A
Bought by
Boettcher Cynthia A
Current Estimated Value
Purchase Details
Closed on
Jul 16, 1999
Sold by
Smith Family Holdings Llc
Bought by
Boettcher Brett A and Boettcher Cynthia A
Home Financials for this Owner
Home Financials are based on the most recent Mortgage that was taken out on this home.
Original Mortgage
$100,000
Outstanding Balance
$27,325
Interest Rate
7.25%
Estimated Equity
$397,430
Create a Home Valuation Report for This Property
The Home Valuation Report is an in-depth analysis detailing your home's value as well as a comparison with similar homes in the area
Home Values in the Area
Average Home Value in this Area
Purchase History
| Date | Buyer | Sale Price | Title Company |
|---|---|---|---|
| Boettcher Cynthia A | -- | None Available | |
| Boettcher Brett A | $125,000 | Western Pioneer Title Co |
Source: Public Records
Mortgage History
| Date | Status | Borrower | Loan Amount |
|---|---|---|---|
| Open | Boettcher Brett A | $100,000 |
Source: Public Records
Tax History Compared to Growth
Tax History
| Year | Tax Paid | Tax Assessment Tax Assessment Total Assessment is a certain percentage of the fair market value that is determined by local assessors to be the total taxable value of land and additions on the property. | Land | Improvement |
|---|---|---|---|---|
| 2024 | $3,529 | $189,896 | -- | -- |
| 2023 | $3,529 | $184,366 | $0 | $0 |
| 2022 | $3,268 | $178,997 | $0 | $0 |
| 2021 | $3,209 | $173,784 | $0 | $0 |
| 2020 | $3,116 | $168,723 | $0 | $0 |
| 2019 | $3,022 | $163,809 | $0 | $0 |
| 2018 | $2,849 | $154,406 | $0 | $0 |
| 2017 | $2,739 | $154,406 | $0 | $0 |
| 2016 | $2,682 | $149,909 | $0 | $0 |
| 2015 | $2,605 | $145,543 | $0 | $0 |
| 2014 | $2,566 | $141,304 | $0 | $0 |
Source: Public Records
Map
Nearby Homes