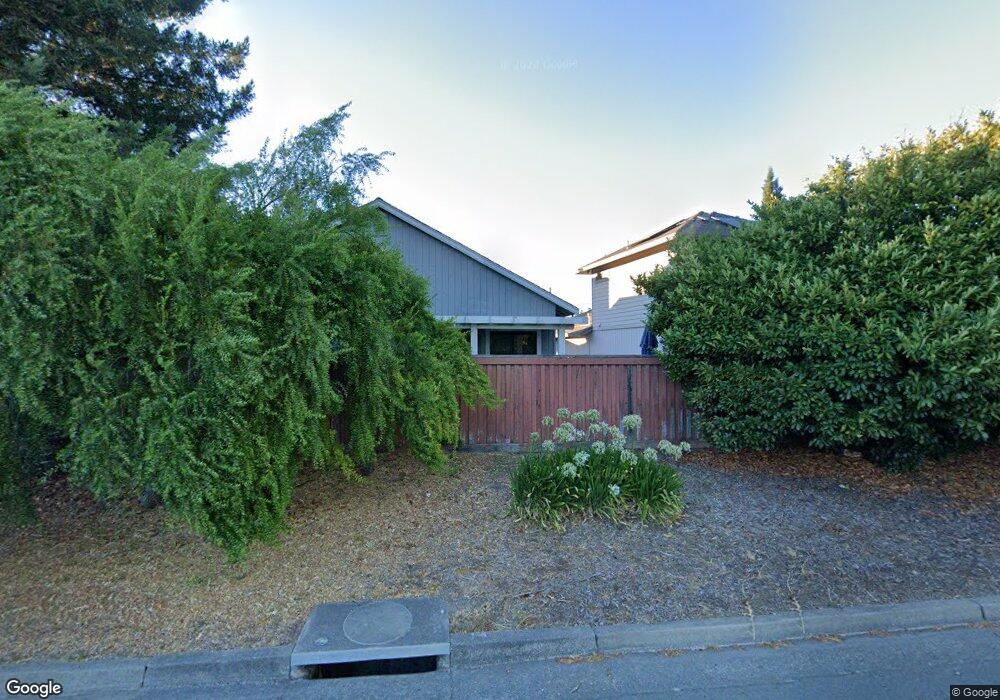
224 S Temelec Cir Sonoma, CA 95476
Estimated Value: $878,000 - $980,000
3
Beds
3
Baths
1,932
Sq Ft
$486/Sq Ft
Est. Value
About This Home
This home is located at 224 S Temelec Cir, Sonoma, CA 95476 and is currently estimated at $938,173, approximately $485 per square foot. 224 S Temelec Cir is a home located in Sonoma County with nearby schools including Prestwood Elementary School, Adele Harrison Middle School, and Creekside High School.
Ownership History
Date
Name
Owned For
Owner Type
Purchase Details
Closed on
Jun 1, 2012
Sold by
Bennett Donald S and The Donald & Sylvia C Bennett
Bought by
Wildmon David E and Wildmon Lynne M
Current Estimated Value
Home Financials for this Owner
Home Financials are based on the most recent Mortgage that was taken out on this home.
Original Mortgage
$306,559
Outstanding Balance
$212,556
Interest Rate
3.84%
Mortgage Type
New Conventional
Estimated Equity
$725,617
Purchase Details
Closed on
May 9, 2006
Sold by
Carlascio Angelo and Carlascio Joanne
Bought by
Smith Bennett Donald S and Smith Bennett Sylvia C
Purchase Details
Closed on
Aug 30, 1999
Sold by
Carlascio Angelo and Carlascio Joanne
Bought by
Carlascio Angelo and Carlascio Jo Anne
Create a Home Valuation Report for This Property
The Home Valuation Report is an in-depth analysis detailing your home's value as well as a comparison with similar homes in the area
Home Values in the Area
Average Home Value in this Area
Purchase History
| Date | Buyer | Sale Price | Title Company |
|---|---|---|---|
| Wildmon David E | $341,000 | First American Title Company | |
| Smith Bennett Donald S | $585,000 | Fidelity National Title Co | |
| Carlascio Angelo | -- | -- |
Source: Public Records
Mortgage History
| Date | Status | Borrower | Loan Amount |
|---|---|---|---|
| Open | Wildmon David E | $306,559 |
Source: Public Records
Tax History Compared to Growth
Tax History
| Year | Tax Paid | Tax Assessment Tax Assessment Total Assessment is a certain percentage of the fair market value that is determined by local assessors to be the total taxable value of land and additions on the property. | Land | Improvement |
|---|---|---|---|---|
| 2025 | $15,435 | $428,301 | $171,445 | $256,856 |
| 2024 | $15,435 | $419,904 | $168,084 | $251,820 |
| 2023 | $15,435 | $411,672 | $164,789 | $246,883 |
| 2022 | $14,942 | $403,601 | $161,558 | $242,043 |
| 2021 | $14,846 | $395,689 | $158,391 | $237,298 |
| 2020 | $14,506 | $391,632 | $156,767 | $234,865 |
| 2019 | $14,487 | $383,954 | $153,694 | $230,260 |
| 2018 | $9,997 | $376,427 | $150,681 | $225,746 |
| 2017 | $9,758 | $369,047 | $147,727 | $221,320 |
| 2016 | $5,105 | $361,812 | $144,831 | $216,981 |
| 2015 | $5,108 | $356,378 | $142,656 | $213,722 |
| 2014 | $4,926 | $349,398 | $139,862 | $209,536 |
Source: Public Records
Map
Nearby Homes
- 166 7 Flags Cir
- 265 Spanish Flag Way
- 265 Spanish Flag Way Unit 291
- 209 Avenida Barbera
- 211 W 7 Flags Cir
- 1329 Avenida Sebastiani
- 110 Calle Merlot
- 14 Fort Ross Way
- 101 Drake Mews
- 70 International Blvd
- 162 Bear Flag Rd
- 100 Vineyard Cir
- 5750 Stage Gulch Rd
- 20986 Via Colombard
- 100 Temelec Cir
- 79 Temelec Cir
- 152 Temelec Cir
- 145 Temelec Cir
- 748 W Watmaugh Rd
- 175 Temelec Cir
- 224 S Temelec Cir
- 238 S Temelec Cir
- 212 S Temelec Cir
- 190 Saint James Dr
- 248 S Temelec Cir
- 186 Saint James Dr
- 200 S Temelec Cir
- 233 S Temelec Cir
- 237 S Temelec Cir
- 241 S Temelec Cir
- 229 S Temelec Cir
- 254 S Temelec Cir
- 182 Saint James Dr
- 245 S Temelec Cir
- 249 S Temelec Cir
- 225 S Temelec Cir
- 260 S Temelec Cir
- 213 S Temelec Cir
- 178 Saint James Dr
- 217 S Temelec Cir