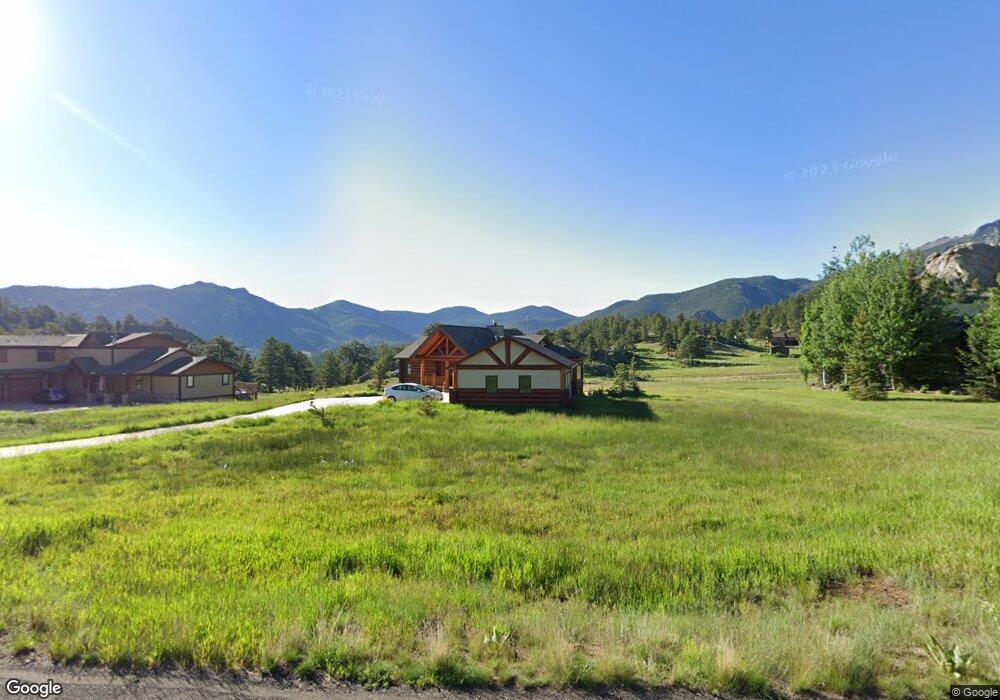
2240 Arapaho Rd Estes Park, CO 80517
Estimated Value: $984,962 - $1,269,000
3
Beds
3
Baths
2,771
Sq Ft
$403/Sq Ft
Est. Value
About This Home
This home is located at 2240 Arapaho Rd, Estes Park, CO 80517 and is currently estimated at $1,115,741, approximately $402 per square foot. 2240 Arapaho Rd is a home located in Larimer County with nearby schools including Estes Park K-5 School, Estes Park Options School, and Estes Park Middle School.
Ownership History
Date
Name
Owned For
Owner Type
Purchase Details
Closed on
May 10, 2013
Sold by
Kirkpatrick Daniel L and Kirkpatrick Julie M
Bought by
Conrad Kevin L and Conrad Heidi T
Current Estimated Value
Purchase Details
Closed on
Mar 27, 2007
Sold by
Orban Daniel D and Catherine Orban M
Bought by
Kirkpatrick Daniel L and Kirkpatrick Julie M
Home Financials for this Owner
Home Financials are based on the most recent Mortgage that was taken out on this home.
Original Mortgage
$235,000
Interest Rate
6.24%
Mortgage Type
Purchase Money Mortgage
Purchase Details
Closed on
Sep 27, 1996
Sold by
Bates Withers James and Bates Withers Jan M
Bought by
Orban Daniel D and Orban Catherine M
Purchase Details
Closed on
Dec 1, 1994
Sold by
Luce Sam A
Bought by
Bates-Withers James
Purchase Details
Closed on
Jun 1, 1993
Sold by
Pinnacel Golf Group
Bought by
Luce Sam A
Create a Home Valuation Report for This Property
The Home Valuation Report is an in-depth analysis detailing your home's value as well as a comparison with similar homes in the area
Home Values in the Area
Average Home Value in this Area
Purchase History
| Date | Buyer | Sale Price | Title Company |
|---|---|---|---|
| Conrad Kevin L | $570,000 | None Available | |
| Kirkpatrick Daniel L | $585,000 | Commonwealth Title | |
| Orban Daniel D | $60,900 | -- | |
| Bates-Withers James | $55,000 | -- | |
| Luce Sam A | -- | -- |
Source: Public Records
Mortgage History
| Date | Status | Borrower | Loan Amount |
|---|---|---|---|
| Previous Owner | Kirkpatrick Daniel L | $235,000 |
Source: Public Records
Tax History Compared to Growth
Tax History
| Year | Tax Paid | Tax Assessment Tax Assessment Total Assessment is a certain percentage of the fair market value that is determined by local assessors to be the total taxable value of land and additions on the property. | Land | Improvement |
|---|---|---|---|---|
| 2025 | $4,286 | $68,896 | $18,760 | $50,136 |
| 2024 | $4,695 | $68,896 | $18,760 | $50,136 |
| 2022 | $3,720 | $48,720 | $13,205 | $35,515 |
| 2021 | $3,820 | $50,122 | $13,585 | $36,537 |
| 2020 | $3,499 | $45,331 | $13,413 | $31,918 |
| 2019 | $3,480 | $45,331 | $13,413 | $31,918 |
| 2018 | $3,392 | $42,854 | $11,160 | $31,694 |
| 2017 | $3,410 | $42,854 | $11,160 | $31,694 |
| 2016 | $3,200 | $42,626 | $12,338 | $30,288 |
| 2015 | $3,234 | $42,630 | $12,340 | $30,290 |
| 2014 | $2,642 | $35,720 | $11,940 | $23,780 |
Source: Public Records
Map
Nearby Homes
- 303 Green Pine Ct
- 345 Green Pine Ct
- 0 Kiowa Ct Unit 1027447
- 419 Whispering Pines Dr
- 1692 Prospect Estates Dr
- 407 Pawnee Dr
- 315 Kiowa Dr
- 2625 Marys Lake Rd Unit 201
- 2625 Marys Lake Rd Unit 40B
- 2625 Marys Lake Rd Unit 101
- 2625 Marys Lake Rd Unit 104
- 384 Prospect Estates Ct
- 2441 Spruce Ave
- 275 Solomon Dr
- 658 Little Prospect Rd
- 151 Curry Dr
- 2630 Ridge Ln
- 197 Curry Dr
- 619 Whispering Pines Dr
- 2319 Spruce Ave