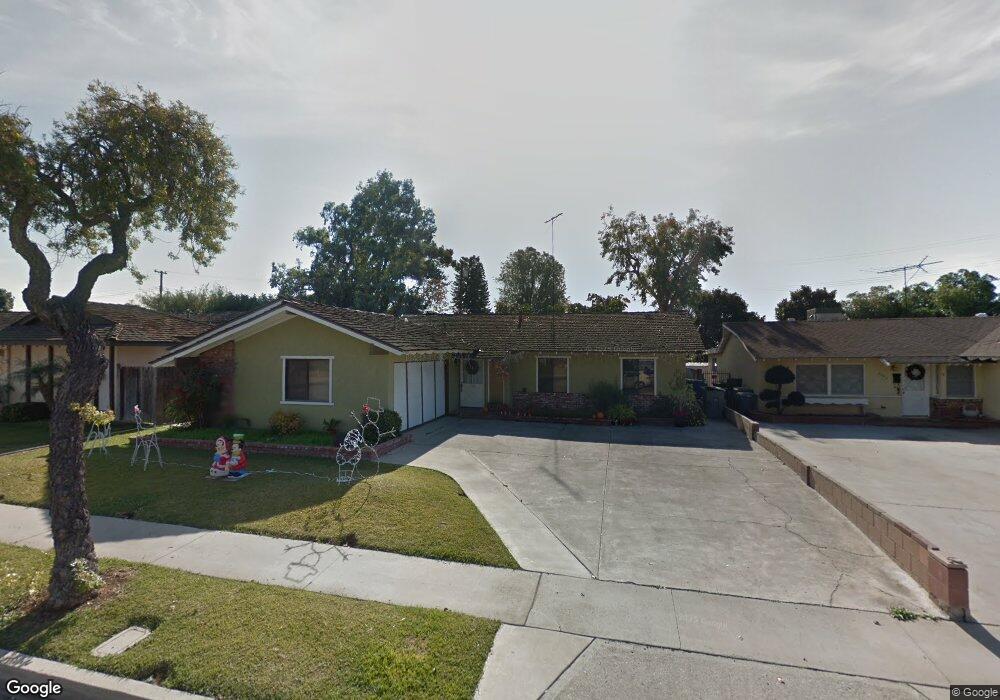
2240 Walling Ave La Habra, CA 90631
Estimated Value: $850,000 - $959,000
3
Beds
2
Baths
1,272
Sq Ft
$700/Sq Ft
Est. Value
About This Home
This home is located at 2240 Walling Ave, La Habra, CA 90631 and is currently estimated at $890,052, approximately $699 per square foot. 2240 Walling Ave is a home located in Orange County with nearby schools including Sierra Vista Elementary School, Ladera Palma Elementary School, and Washington Middle School.
Ownership History
Date
Name
Owned For
Owner Type
Purchase Details
Closed on
Jun 8, 2011
Sold by
Hertzberg John F and Hertzberg Maria Lourdes
Bought by
Hertzberg John F and Hertzberg Maria Lourdes
Current Estimated Value
Home Financials for this Owner
Home Financials are based on the most recent Mortgage that was taken out on this home.
Original Mortgage
$170,000
Outstanding Balance
$11,582
Interest Rate
4.63%
Mortgage Type
New Conventional
Estimated Equity
$878,470
Purchase Details
Closed on
Oct 17, 2001
Sold by
Lee Marcy and Hertzberg John F
Bought by
Hertzberg John F and Hertzberg Maria Lourdes Gaerlan
Home Financials for this Owner
Home Financials are based on the most recent Mortgage that was taken out on this home.
Original Mortgage
$196,000
Interest Rate
6.62%
Purchase Details
Closed on
Jul 17, 1993
Sold by
Whitten Marcy Ann
Bought by
Whitten Marcy Ann and Hertzberg John Fredrick
Create a Home Valuation Report for This Property
The Home Valuation Report is an in-depth analysis detailing your home's value as well as a comparison with similar homes in the area
Home Values in the Area
Average Home Value in this Area
Purchase History
We collect this data history from publicly available records. To have your information removed, we recommend requesting removal directly through your county’s website.
| Date | Buyer | Sale Price | Title Company |
|---|---|---|---|
| Hertzberg John F | -- | Chicago Title Company | |
| Hertzberg John F | -- | Fidelity National Title Ins | |
| Whitten Marcy Ann | -- | -- |
Source: Public Records
Mortgage History
We collect this data history from publicly available records. To have your information removed, we recommend requesting removal directly through your county’s website.
| Date | Status | Borrower | Loan Amount |
|---|---|---|---|
| Open | Hertzberg John F | $170,000 | |
| Closed | Hertzberg John F | $196,000 |
Source: Public Records
Tax History
| Year | Tax Paid | Tax Assessment Tax Assessment Total Assessment is a certain percentage of the fair market value that is determined by local assessors to be the total taxable value of land and additions on the property. | Land | Improvement |
|---|---|---|---|---|
| 2025 | $2,175 | $174,549 | $101,362 | $73,187 |
| 2024 | $2,175 | $171,127 | $99,375 | $71,752 |
| 2023 | $2,121 | $167,772 | $97,426 | $70,346 |
| 2022 | $2,093 | $164,483 | $95,516 | $68,967 |
| 2021 | $2,058 | $161,258 | $93,643 | $67,615 |
| 2020 | $2,038 | $159,605 | $92,683 | $66,922 |
| 2019 | $1,986 | $156,476 | $90,866 | $65,610 |
| 2018 | $1,953 | $153,408 | $89,084 | $64,324 |
| 2017 | $3,411 | $280,029 | $207,608 | $72,421 |
| 2016 | $3,332 | $274,539 | $203,538 | $71,001 |
| 2015 | $3,238 | $270,416 | $200,481 | $69,935 |
| 2014 | $3,143 | $265,119 | $196,553 | $68,566 |
Source: Public Records
Map
Nearby Homes
- 450 Palermo Way
- 1406 Carey Ave
- 1414 W Central Ave Unit 81
- 1414 W Central Ave Unit 98
- 1414 W Central Ave Unit 19
- 1414 W Central Ave Unit 34
- 1414 W Central Ave Unit 69
- 1831 Hodson Ave
- 692 Archwood Ave
- 751 Village Lake Mall
- 736 Terrace Lake Dr Unit 324
- 1146 N Puente St
- 736 Knoll Lake Dr Unit 266
- 1720 Hodson Ave
- 1266 Harbor Lake Ave Unit 160
- 1235 Harbor Lake Ave Unit 13
- 1414 Las Lomas Dr
- 675 Wood Lake Dr Unit 186
- 685 Wood Lake Dr Unit 184
- 2210 Lake View Dr Unit 139
- 2250 Walling Ave
- 2230 Walling Ave
- 2300 Walling Ave
- 2301 Mccart Ave
- 2311 Mccart Ave
- 2241 Walling Ave
- 2310 Walling Ave
- 2321 Mccart Ave
- 311 Roscoe St
- 2251 Walling Ave
- 350 Holgate St
- 2301 Walling Ave
- 2331 Mccart Ave
- 2221 Walling Ave
- 340 Holgate St
- 2320 Walling Ave
- 330 Holgate St
- 2311 Walling Ave
- 301 Roscoe St
- 420 Holgate St
Your Personal Tour Guide
Ask me questions while you tour the home.