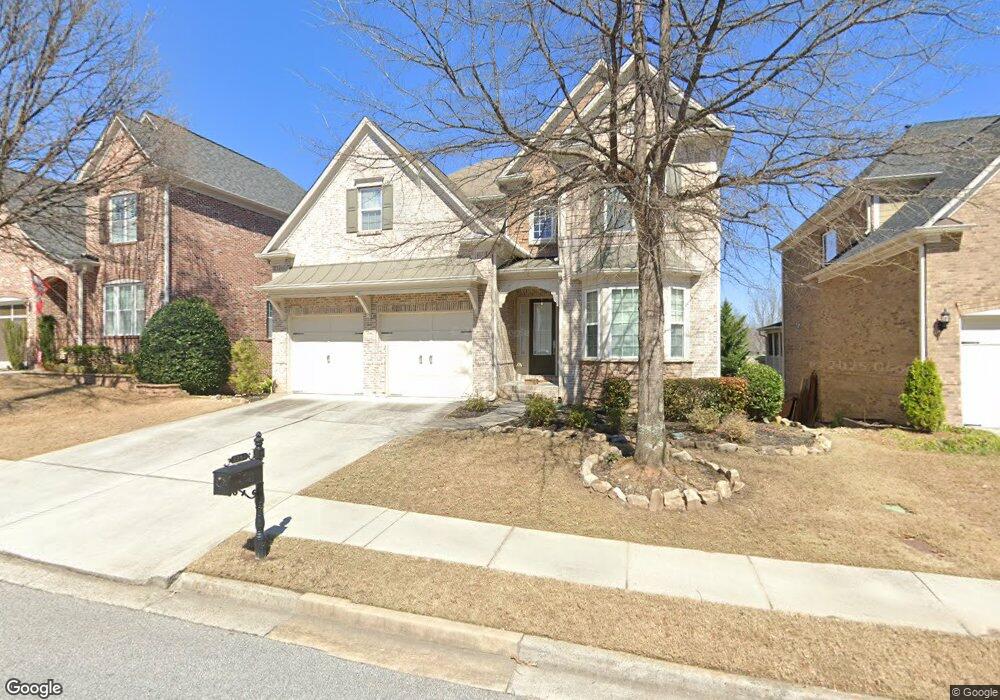
2241 Fort Dr SE Smyrna, GA 30080
Estimated Value: $708,394 - $748,000
4
Beds
4
Baths
3,045
Sq Ft
$240/Sq Ft
Est. Value
About This Home
This home is located at 2241 Fort Dr SE, Smyrna, GA 30080 and is currently estimated at $731,849, approximately $240 per square foot. 2241 Fort Dr SE is a home located in Cobb County with nearby schools including Nickajack Elementary School, Campbell Middle School, and Campbell High School.
Ownership History
Date
Name
Owned For
Owner Type
Purchase Details
Closed on
Oct 14, 2016
Sold by
Thomas O
Bought by
Kesler Thomas O and Kesler Lindsey M
Current Estimated Value
Home Financials for this Owner
Home Financials are based on the most recent Mortgage that was taken out on this home.
Original Mortgage
$235,000
Outstanding Balance
$108,959
Interest Rate
3.5%
Mortgage Type
New Conventional
Estimated Equity
$622,890
Purchase Details
Closed on
Oct 29, 2010
Sold by
Blackford Todd and Blackford Melissa
Bought by
Odell Thomas and Kesler Lindsey
Home Financials for this Owner
Home Financials are based on the most recent Mortgage that was taken out on this home.
Original Mortgage
$260,000
Interest Rate
4.37%
Mortgage Type
New Conventional
Purchase Details
Closed on
Apr 18, 2008
Sold by
Pulte Hm Corp
Bought by
Blackford Todd and Blackford Melissa
Home Financials for this Owner
Home Financials are based on the most recent Mortgage that was taken out on this home.
Original Mortgage
$381,984
Interest Rate
5.84%
Mortgage Type
New Conventional
Create a Home Valuation Report for This Property
The Home Valuation Report is an in-depth analysis detailing your home's value as well as a comparison with similar homes in the area
Home Values in the Area
Average Home Value in this Area
Purchase History
| Date | Buyer | Sale Price | Title Company |
|---|---|---|---|
| Kesler Thomas O | -- | -- | |
| Odell Thomas | $360,000 | -- | |
| Blackford Todd | $477,500 | -- |
Source: Public Records
Mortgage History
| Date | Status | Borrower | Loan Amount |
|---|---|---|---|
| Open | Kesler Thomas O | $235,000 | |
| Previous Owner | Odell Thomas | $260,000 | |
| Previous Owner | Blackford Todd | $381,984 |
Source: Public Records
Tax History Compared to Growth
Tax History
| Year | Tax Paid | Tax Assessment Tax Assessment Total Assessment is a certain percentage of the fair market value that is determined by local assessors to be the total taxable value of land and additions on the property. | Land | Improvement |
|---|---|---|---|---|
| 2025 | $7,556 | $295,308 | $58,000 | $237,308 |
| 2024 | $6,213 | $233,100 | $42,000 | $191,100 |
| 2023 | $5,670 | $233,100 | $42,000 | $191,100 |
| 2022 | $6,257 | $233,100 | $42,000 | $191,100 |
| 2021 | $5,120 | $181,140 | $42,000 | $139,140 |
| 2020 | $4,470 | $156,283 | $37,800 | $118,483 |
| 2019 | $4,956 | $173,648 | $42,000 | $131,648 |
| 2018 | $4,920 | $172,000 | $38,000 | $134,000 |
| 2017 | $4,667 | $172,000 | $38,000 | $134,000 |
| 2016 | $4,598 | $168,820 | $38,000 | $130,820 |
| 2015 | $4,973 | $168,820 | $38,000 | $130,820 |
| 2014 | $4,278 | $144,000 | $0 | $0 |
Source: Public Records
Map
Nearby Homes
- 2335 Millhaven St SE
- 2591 Speer Ct SE
- 4652 Prater Way SE
- 2432 Whiteoak Run Unit 20
- 4805 W Village Way SE Unit 3207
- 4805 W Village Way SE Unit 2204
- 5008 Whiteoak Pointe SE Unit 15
- 2396 Whiteoak Bend SE Unit 16
- 4957 Warmstone Way SE Unit 15
- 4957 Warmstone Way SE
- 3895 Old Atlanta Station Dr SE Unit 1
- 5080 Whiteoak Terrace SE
- 2145 W Village Crossing SE
- 5013 Groover Dr SE
- 4651 Eddibunn Dr SE
- 4738 Ivy Ridge Dr SE
- 5233 Whiteoak Ave SE
- 2311 English Ivy Ct SE Unit 23
- 4471 Redan Ct
- 2276 Whiteoak Dr SE
- 2245 Fort St SE
- 2245 Fort Dr SE
- 2223 Fort Dr SE
- 2249 Fort Dr SE
- 4681 Prater Way SE
- 4649 Prater Way SE
- 4645 Prater Way SE
- 4653 Prater Way SE
- 2253 Fort Dr SE
- 2253 Fort Dr
- 2240 Fort Dr SE
- 2240 Fort St SE
- 2244 Fort Dr SE
- 2244 Fort St SE
- 2236 Fort Dr SE
- 2236 Fort St SE
- 2232 Fort Dr SE
- 2232 Fort St SE
- 2248 Fort St SE
- 4635 Prater Way SE