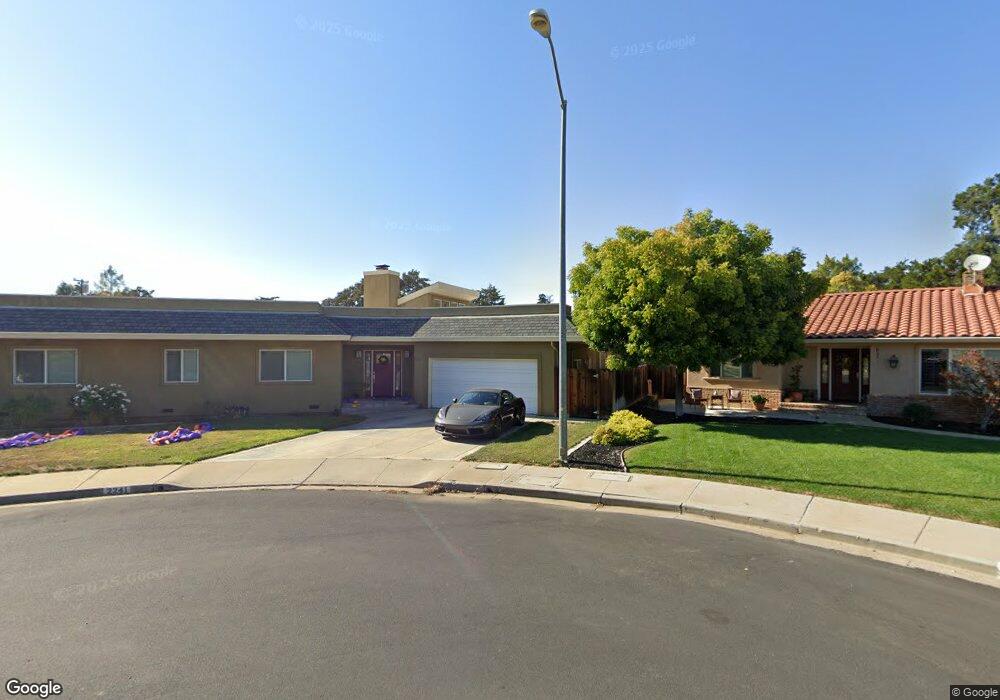
2241 Sherry Ct Livermore, CA 94550
Estimated Value: $1,608,000 - $1,692,000
3
Beds
3
Baths
2,932
Sq Ft
$565/Sq Ft
Est. Value
About This Home
This home is located at 2241 Sherry Ct, Livermore, CA 94550 and is currently estimated at $1,656,265, approximately $564 per square foot. 2241 Sherry Ct is a home located in Alameda County with nearby schools including East Avenue Middle School, Livermore High School, and Our Savior Lutheran.
Ownership History
Date
Name
Owned For
Owner Type
Purchase Details
Closed on
Jul 24, 2018
Sold by
Rourke John K O and Rourke Traci L O
Bought by
Lynne O Rourke John Kent and Rourke Traci Lynne O
Current Estimated Value
Home Financials for this Owner
Home Financials are based on the most recent Mortgage that was taken out on this home.
Original Mortgage
$664,500
Outstanding Balance
$577,162
Interest Rate
4.6%
Mortgage Type
New Conventional
Estimated Equity
$1,079,103
Purchase Details
Closed on
Jan 17, 2007
Sold by
Orourke Traci L
Bought by
Orourke John K
Home Financials for this Owner
Home Financials are based on the most recent Mortgage that was taken out on this home.
Original Mortgage
$655,900
Interest Rate
6%
Mortgage Type
New Conventional
Purchase Details
Closed on
Oct 12, 1997
Sold by
Achee Brenton B 2Nd & Patricia G
Bought by
Orourke John K and Orourke Traci L
Home Financials for this Owner
Home Financials are based on the most recent Mortgage that was taken out on this home.
Original Mortgage
$286,500
Interest Rate
7.06%
Create a Home Valuation Report for This Property
The Home Valuation Report is an in-depth analysis detailing your home's value as well as a comparison with similar homes in the area
Home Values in the Area
Average Home Value in this Area
Purchase History
| Date | Buyer | Sale Price | Title Company |
|---|---|---|---|
| Lynne O Rourke John Kent | -- | Fidelity National Title Comp | |
| Orourke John K | -- | Fidelity National Title Co | |
| Orourke John K | -- | Fidelity National Title Co | |
| Orourke John K | $360,000 | First American Title Guarant |
Source: Public Records
Mortgage History
| Date | Status | Borrower | Loan Amount |
|---|---|---|---|
| Open | Lynne O Rourke John Kent | $664,500 | |
| Closed | Orourke John K | $655,900 | |
| Previous Owner | Orourke John K | $286,500 | |
| Closed | Orourke John K | $55,500 |
Source: Public Records
Tax History Compared to Growth
Tax History
| Year | Tax Paid | Tax Assessment Tax Assessment Total Assessment is a certain percentage of the fair market value that is determined by local assessors to be the total taxable value of land and additions on the property. | Land | Improvement |
|---|---|---|---|---|
| 2025 | $7,464 | $567,800 | $172,440 | $402,360 |
| 2024 | $7,464 | $556,532 | $169,059 | $394,473 |
| 2023 | $7,347 | $552,484 | $165,745 | $386,739 |
| 2022 | $7,236 | $534,651 | $162,495 | $379,156 |
| 2021 | $6,343 | $524,031 | $159,309 | $371,722 |
| 2020 | $6,875 | $525,588 | $157,676 | $367,912 |
| 2019 | $6,900 | $515,285 | $154,585 | $360,700 |
| 2018 | $6,749 | $505,184 | $151,555 | $353,629 |
| 2017 | $6,572 | $495,280 | $148,584 | $346,696 |
| 2016 | $6,325 | $485,571 | $145,671 | $339,900 |
| 2015 | $5,937 | $478,277 | $143,483 | $334,794 |
| 2014 | $5,832 | $468,910 | $140,673 | $328,237 |
Source: Public Records
Map
Nearby Homes
- 2211 College Ave
- 1153 Sherry Way
- 1909 De Vaca Way
- 1810 Peary Way
- 1004 Vienna St
- 772 Mcleod St
- 3283 East Ave
- 1623 4th St
- 1727 2nd St
- 1324 Chateau Common Unit 206
- 2602 Lucca Ct
- 3732 Carrigan Common
- 1948 Railroad Ave Unit 104
- 161 N L St Unit 101
- 2878 4th St Unit 1401
- 1467 Hudson Way
- 2908 Worthing Common
- 3491 Madeira Way
- 1087 Murrieta Blvd Unit 242
- 1087 Murrieta Blvd Unit 245
- 1050 Angelica Way
- 2239 Sherry Ct
- 1034 Angelica Way
- 1066 Angelica Way
- 1018 Angelica Way
- 1082 Angelica Way
- 2227 Sherry Ct
- 2215 Sherry Ct
- 2265 Sherry Ct
- 1098 Angelica Way
- 1002 Angelica Way
- 1002 Angelica Way
- 2225 College Ave
- 1051 Angelica Way
- 2273 Sherry Ct
- 1035 Angelica Way
- 1063 Angelica Way
- 1023 Sherry Way
- 2203 Sherry Ct
- 1017 Sherry Way