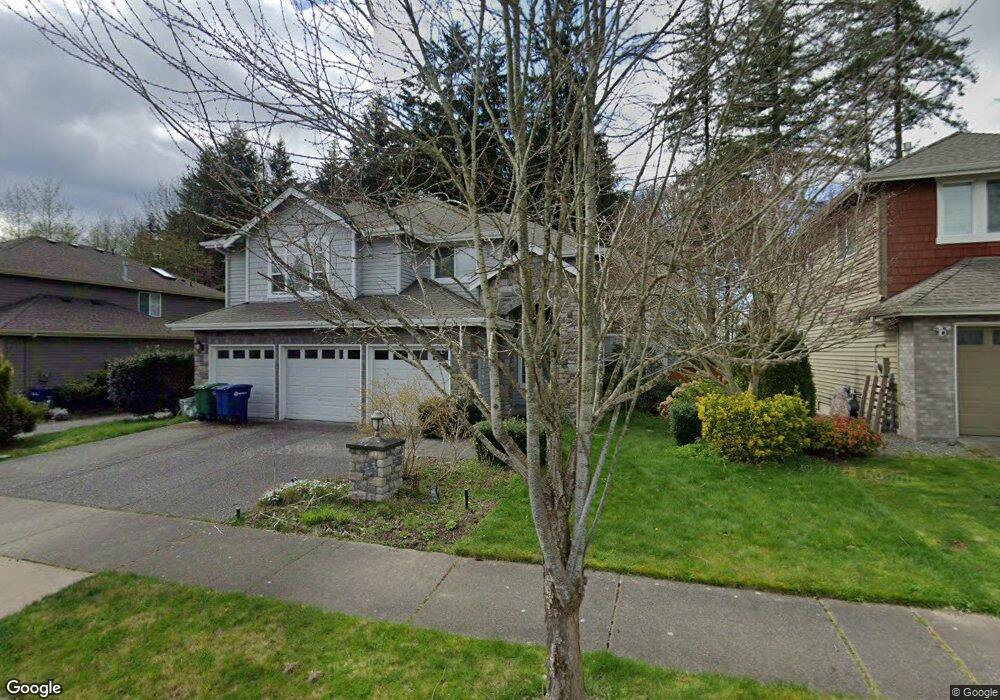
22414 6th Place W Bothell, WA 98021
Queensborough-Brentwood NeighborhoodEstimated Value: $1,326,663 - $1,614,000
4
Beds
3
Baths
3,067
Sq Ft
$462/Sq Ft
Est. Value
About This Home
This home is located at 22414 6th Place W, Bothell, WA 98021 and is currently estimated at $1,416,666, approximately $461 per square foot. 22414 6th Place W is a home located in Snohomish County with nearby schools including Frank Love Elementary School, Kenmore Middle School, and Bothell High School.
Ownership History
Date
Name
Owned For
Owner Type
Purchase Details
Closed on
Mar 16, 2012
Sold by
Wu Jeremy Y
Bought by
Wu Jeremy Y and Wu Ophelia
Current Estimated Value
Home Financials for this Owner
Home Financials are based on the most recent Mortgage that was taken out on this home.
Original Mortgage
$398,000
Outstanding Balance
$48,767
Interest Rate
3.15%
Mortgage Type
New Conventional
Estimated Equity
$1,367,899
Purchase Details
Closed on
May 20, 2008
Sold by
Bharwani Sadrudin H and Bharwani Veena
Bought by
Wu Jeremy
Home Financials for this Owner
Home Financials are based on the most recent Mortgage that was taken out on this home.
Original Mortgage
$417,000
Interest Rate
6%
Mortgage Type
Purchase Money Mortgage
Purchase Details
Closed on
May 17, 2007
Sold by
Brooks Homes Inc
Bought by
Bharwani Sadrudin H and Bharwani Veena
Home Financials for this Owner
Home Financials are based on the most recent Mortgage that was taken out on this home.
Original Mortgage
$519,920
Interest Rate
6.17%
Mortgage Type
Purchase Money Mortgage
Create a Home Valuation Report for This Property
The Home Valuation Report is an in-depth analysis detailing your home's value as well as a comparison with similar homes in the area
Home Values in the Area
Average Home Value in this Area
Purchase History
| Date | Buyer | Sale Price | Title Company |
|---|---|---|---|
| Wu Jeremy Y | -- | First American | |
| Wu Jeremy | $640,000 | The Talon Group | |
| Bharwani Sadrudin H | $649,900 | Chicago Title |
Source: Public Records
Mortgage History
| Date | Status | Borrower | Loan Amount |
|---|---|---|---|
| Open | Wu Jeremy Y | $398,000 | |
| Closed | Wu Jeremy | $417,000 | |
| Previous Owner | Bharwani Sadrudin H | $519,920 |
Source: Public Records
Tax History
| Year | Tax Paid | Tax Assessment Tax Assessment Total Assessment is a certain percentage of the fair market value that is determined by local assessors to be the total taxable value of land and additions on the property. | Land | Improvement |
|---|---|---|---|---|
| 2025 | $9,007 | $1,113,300 | $545,900 | $567,400 |
| 2024 | $9,007 | $1,072,700 | $551,100 | $521,600 |
| 2023 | $9,513 | $1,238,600 | $638,600 | $600,000 |
| 2022 | $9,253 | $973,800 | $464,500 | $509,300 |
| 2020 | $8,624 | $841,700 | $376,300 | $465,400 |
| 2019 | $7,501 | $838,800 | $376,300 | $462,500 |
| 2018 | $7,021 | $683,600 | $275,000 | $408,600 |
| 2017 | $5,987 | $589,200 | $205,000 | $384,200 |
| 2016 | $6,129 | $624,500 | $190,000 | $434,500 |
Source: Public Records
Map
Nearby Homes
- 531 221st St SW
- 308 225th St SW
- 22709 12th Place W
- 422 216th St SW
- 22827 Meridian Ave S
- 625 215th St SW
- 23318 3rd Place W
- 410 214th St SW Unit B
- 22213 17th Ave W
- 18 232nd Place SW
- 22226 17th Ave W
- 17 232nd Place SE
- 604 213th St SW
- 931 236th Place SW
- 1017 236th Place SW
- 23619 5th Ave W
- 21723 3rd Ave SE
- 23506 13th Place W
- 33 213th Place SW
- 21414 2nd Ave SE
- 22408 6th Place W
- 22420 6th Place W
- 22424 6th Place W
- 22402 6th Place W
- 22415 6th Place W
- 22409 6th Place W
- 22421 6th Place W
- 22403 6th Place W
- 22427 6th Place W
- 717 224th St SW
- 22410 5th Place W
- 22404 5th Place W
- 22416 5th Place W
- 22422 5th Place W
- 621 224th St SW
- 22428 5th Place W
- 719 224th St SW
- 22518 5th Place W
- 22415 5th Place W
- 22411 5th Place W
Your Personal Tour Guide
Ask me questions while you tour the home.