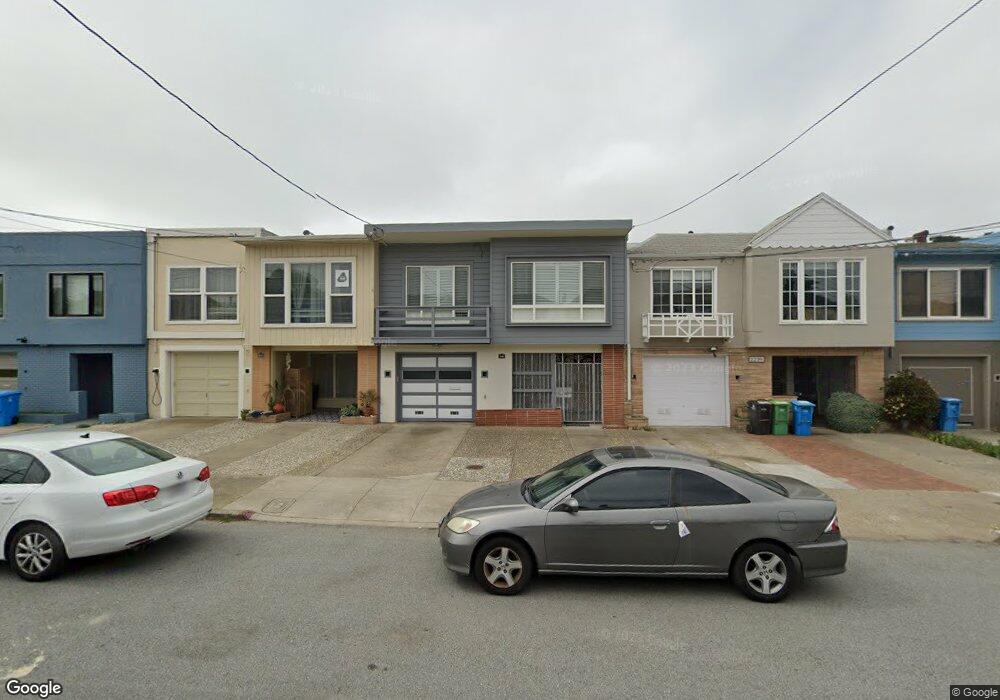
2243 39th Ave San Francisco, CA 94116
Outer Parkside NeighborhoodEstimated Value: $1,181,101 - $1,617,000
2
Beds
1
Bath
1,169
Sq Ft
$1,197/Sq Ft
Est. Value
About This Home
This home is located at 2243 39th Ave, San Francisco, CA 94116 and is currently estimated at $1,399,525, approximately $1,197 per square foot. 2243 39th Ave is a home located in San Francisco County with nearby schools including Sunset Elementary School, Giannini (A.P.) Middle School, and St. Gabriel School.
Ownership History
Date
Name
Owned For
Owner Type
Purchase Details
Closed on
Jan 22, 2021
Sold by
Mancilla Fernando S and Chang Dollace
Bought by
Khaw Julie P and Khaw Revocable Trust
Current Estimated Value
Purchase Details
Closed on
Aug 12, 2002
Sold by
Khaw Julie P Ngo
Bought by
Khaw Julie P Ngo and Mancilla Fernando S
Create a Home Valuation Report for This Property
The Home Valuation Report is an in-depth analysis detailing your home's value as well as a comparison with similar homes in the area
Home Values in the Area
Average Home Value in this Area
Purchase History
| Date | Buyer | Sale Price | Title Company |
|---|---|---|---|
| Khaw Julie P | -- | None Available | |
| Khaw Julie P Ngo | -- | -- |
Source: Public Records
Tax History Compared to Growth
Tax History
| Year | Tax Paid | Tax Assessment Tax Assessment Total Assessment is a certain percentage of the fair market value that is determined by local assessors to be the total taxable value of land and additions on the property. | Land | Improvement |
|---|---|---|---|---|
| 2025 | $2,135 | $183,414 | $56,597 | $126,817 |
| 2024 | $2,135 | $179,819 | $55,488 | $124,331 |
| 2023 | $2,105 | $176,294 | $54,400 | $121,894 |
| 2022 | $2,067 | $172,838 | $53,334 | $119,504 |
| 2021 | $2,032 | $169,450 | $52,289 | $117,161 |
| 2020 | $2,036 | $167,638 | $51,723 | $115,915 |
| 2019 | $1,968 | $164,353 | $50,709 | $113,644 |
| 2018 | $2,491 | $161,124 | $49,713 | $111,411 |
| 2017 | $2,162 | $157,968 | $48,741 | $109,227 |
| 2016 | $2,096 | $154,875 | $47,787 | $107,088 |
| 2015 | $2,067 | $152,550 | $47,070 | $105,480 |
| 2014 | $2,012 | $149,565 | $46,149 | $103,416 |
Source: Public Records
Map
Nearby Homes
- 2170 43rd Ave
- 2142 43rd Ave
- 3622 Rivera St
- 2262 47th Ave
- 1970 35th Ave
- 1862 40th Ave
- 2306 32nd Ave
- 1834 38th Ave
- 2139 Taraval St
- 2091 31st Ave
- 2078 31st Ave
- 3400 Vicente St
- 1783 40th Ave
- 2026 Great Hwy
- 2254 30th Ave
- 2391-2393 30th Ave
- 1775 37th Ave
- 2466 31st Ave
- 2225 Vicente St Unit 1
- 2225 Vicente St