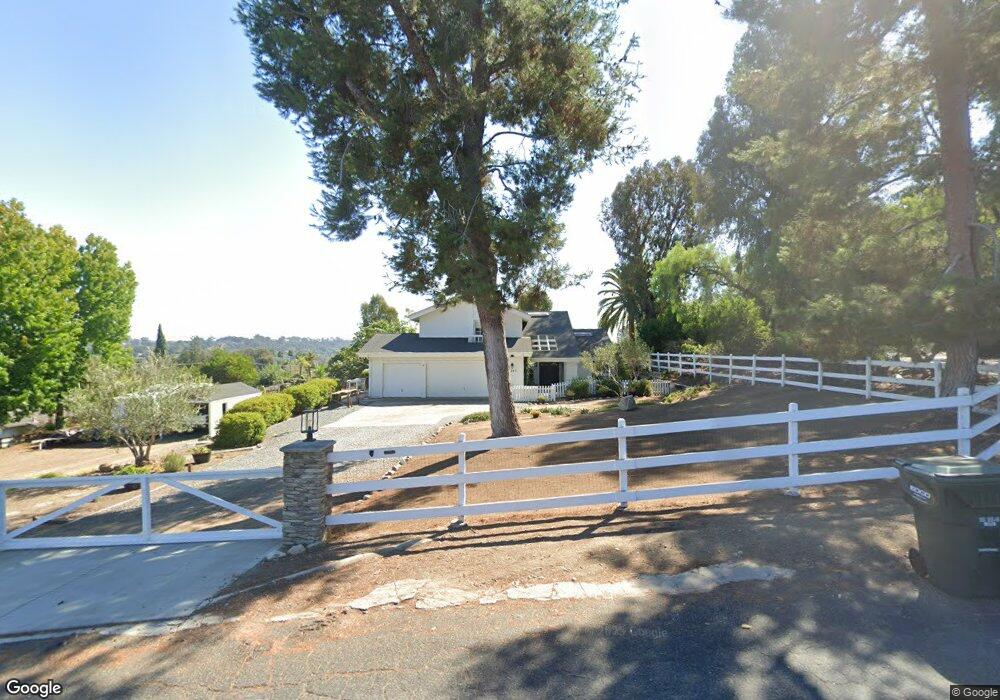
2243 Ranch View Terrace Encinitas, CA 92024
Central Encinitas NeighborhoodEstimated Value: $2,218,000 - $2,482,000
3
Beds
3
Baths
2,272
Sq Ft
$1,014/Sq Ft
Est. Value
About This Home
This home is located at 2243 Ranch View Terrace, Encinitas, CA 92024 and is currently estimated at $2,303,767, approximately $1,013 per square foot. 2243 Ranch View Terrace is a home located in San Diego County with nearby schools including Olivenhain Pioneer Elementary, Diegueno Middle School, and La Costa Canyon High School.
Ownership History
Date
Name
Owned For
Owner Type
Purchase Details
Closed on
Apr 24, 2013
Sold by
Stockton Susan Kathleen and Stockton David Boardman
Bought by
Stockton Susan Kathleen and Stockton David Boardman
Current Estimated Value
Home Financials for this Owner
Home Financials are based on the most recent Mortgage that was taken out on this home.
Original Mortgage
$50,000
Outstanding Balance
$35,341
Interest Rate
3.5%
Mortgage Type
Future Advance Clause Open End Mortgage
Estimated Equity
$2,268,426
Purchase Details
Closed on
Jul 12, 1994
Sold by
Stockton David B and Stockton Susan K
Bought by
David B & Susan K Stockton Revocable
Purchase Details
Closed on
Sep 29, 1987
Create a Home Valuation Report for This Property
The Home Valuation Report is an in-depth analysis detailing your home's value as well as a comparison with similar homes in the area
Home Values in the Area
Average Home Value in this Area
Purchase History
| Date | Buyer | Sale Price | Title Company |
|---|---|---|---|
| Stockton Susan Kathleen | -- | Lawyers Title Sd | |
| David B & Susan K Stockton Revocable | -- | -- | |
| -- | $320,000 | -- |
Source: Public Records
Mortgage History
| Date | Status | Borrower | Loan Amount |
|---|---|---|---|
| Open | Stockton Susan Kathleen | $50,000 |
Source: Public Records
Tax History Compared to Growth
Tax History
| Year | Tax Paid | Tax Assessment Tax Assessment Total Assessment is a certain percentage of the fair market value that is determined by local assessors to be the total taxable value of land and additions on the property. | Land | Improvement |
|---|---|---|---|---|
| 2025 | $6,424 | $612,485 | $270,210 | $342,275 |
| 2024 | $6,424 | $600,476 | $264,912 | $335,564 |
| 2023 | $6,277 | $588,703 | $259,718 | $328,985 |
| 2022 | $6,151 | $577,161 | $254,626 | $322,535 |
| 2021 | $6,072 | $565,845 | $249,634 | $316,211 |
| 2020 | $5,998 | $560,044 | $247,075 | $312,969 |
| 2019 | $5,872 | $549,064 | $242,231 | $306,833 |
| 2018 | $5,780 | $538,299 | $237,482 | $300,817 |
| 2017 | $5,675 | $527,745 | $232,826 | $294,919 |
| 2016 | $5,493 | $517,398 | $228,261 | $289,137 |
| 2015 | $5,416 | $509,627 | $224,833 | $284,794 |
| 2014 | $5,306 | $499,645 | $220,429 | $279,216 |
Source: Public Records
Map
Nearby Homes
- 339 Rancho Santa fe Rd
- 277 Via Del Cerrito
- 612 Lucylle Ln
- 1926 Springdale Ln
- 710 Edelweiss Ln
- 459 Flores de Oro
- 711 La Quebrada
- 1829 Forestdale Dr
- 220 S Shorehang Ln
- 2005 Countrywood Ct
- 155 Countrywood Ln
- 1741 Charleston Ln
- 1824 Eastwood Ln
- 1838 Stonebrook Ln
- 1716 Kellington Place
- 1785 Caliban Dr
- 2815 Santa fe Vista Ct
- 5305 La Crescenta
- 0 Calle Rancho Vista Unit 18 250040119
- 4149 Manchester Ave
- 2253 Ranch View Terrace
- 2231 Ranch View Terrace
- 2227 Ranch View Terrace
- 2234 Woodwind Dr
- 2222 Ranch View Terrace
- 2209 7th St
- 2209 Ranch View Terrace
- 2222 Woodwind Dr
- 2230 Woodwind Dr
- 2345 7th St
- 0 Ranch View Terrace
- 2201 Ranch View Terrace
- 347 Rancho Santa fe Rd
- 345 Rancho Santa fe Rd
- 2204 Woodwind Dr
- 2202 Ranch View Terrace
- 335 Rancho Santa fe Rd
- 2262 Woodwind Dr
- 444 Rancho Santa fe Rd
- 446 Rancho Santa fe Rd