2244 2nd St Napa, CA 94559
Central Napa NeighborhoodEstimated Value: $887,000 - $943,000
4
Beds
2
Baths
1,656
Sq Ft
$547/Sq Ft
Est. Value
About This Home
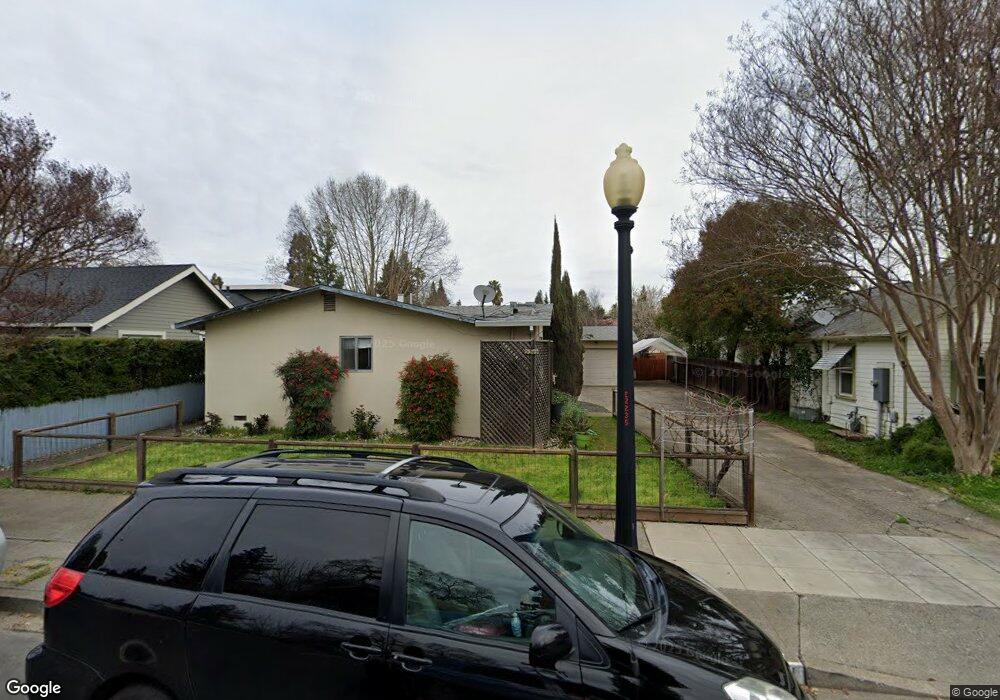
This home is located at 2244 2nd St, Napa, CA 94559 and is currently estimated at $906,069, approximately $547 per square foot. 2244 2nd St is a home located in Napa County with nearby schools including Shearer Elementary School, Redwood Middle School, and Napa High School.
Ownership History
Date
Name
Owned For
Owner Type
Purchase Details
Closed on
May 3, 2010
Sold by
Ross Dalfred E and Lucas Linda C
Bought by
Ross Dalfred E and Lucas Linda
Current Estimated Value
Purchase Details
Closed on
Dec 1, 2000
Sold by
Finchum Julia M Tr and Robert H
Bought by
Ross Dalfred E and Lucas Linda C
Home Financials for this Owner
Home Financials are based on the most recent Mortgage that was taken out on this home.
Original Mortgage
$220,000
Interest Rate
7.67%
Create a Home Valuation Report for This Property
The Home Valuation Report is an in-depth analysis detailing your home's value as well as a comparison with similar homes in the area
Home Values in the Area
Average Home Value in this Area
Purchase History
| Date | Buyer | Sale Price | Title Company |
|---|---|---|---|
| Ross Dalfred E | -- | None Available | |
| Ross Dalfred E | $275,000 | First American Title Co |
Source: Public Records
Mortgage History
| Date | Status | Borrower | Loan Amount |
|---|---|---|---|
| Closed | Ross Dalfred E | $220,000 |
Source: Public Records
Tax History
| Year | Tax Paid | Tax Assessment Tax Assessment Total Assessment is a certain percentage of the fair market value that is determined by local assessors to be the total taxable value of land and additions on the property. | Land | Improvement |
|---|---|---|---|---|
| 2025 | $5,903 | $414,361 | $197,385 | $216,976 |
| 2024 | $5,797 | $406,237 | $193,515 | $212,722 |
| 2023 | $5,797 | $398,272 | $189,721 | $208,551 |
| 2022 | $5,767 | $390,463 | $186,001 | $204,462 |
| 2021 | $5,758 | $382,807 | $182,354 | $200,453 |
| 2020 | $5,782 | $378,883 | $180,485 | $198,398 |
| 2019 | $5,645 | $371,455 | $176,947 | $194,508 |
| 2018 | $5,537 | $364,173 | $173,478 | $190,695 |
| 2017 | $5,394 | $357,033 | $170,077 | $186,956 |
| 2016 | $5,194 | $350,034 | $166,743 | $183,291 |
| 2015 | -- | $344,777 | $164,239 | $180,538 |
| 2014 | $4,734 | $338,024 | $161,022 | $177,002 |
Source: Public Records
Map
Nearby Homes
Your Personal Tour Guide
Ask me questions while you tour the home.