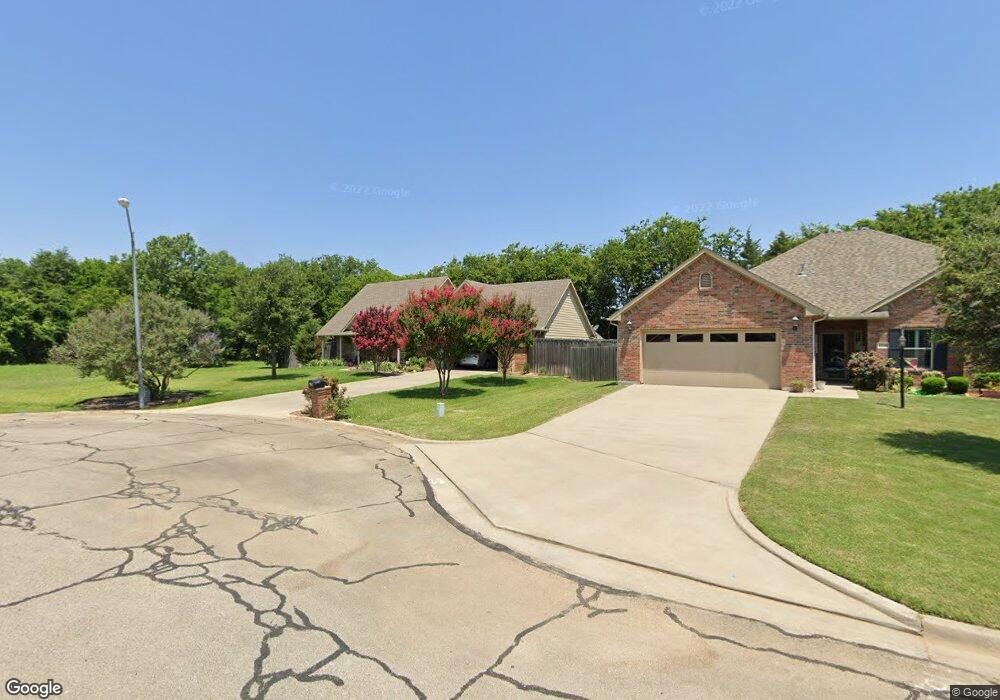
2244 N Village Dr Bonham, TX 75418
Estimated Value: $320,000 - $352,000
3
Beds
2
Baths
2,000
Sq Ft
$169/Sq Ft
Est. Value
About This Home
This home is located at 2244 N Village Dr, Bonham, TX 75418 and is currently estimated at $337,741, approximately $168 per square foot. 2244 N Village Dr is a home located in Fannin County with nearby schools including Finley-Oates Elementary School and LH Rather Jr High School.
Ownership History
Date
Name
Owned For
Owner Type
Purchase Details
Closed on
Feb 18, 2010
Sold by
Frair Belva Randall
Bought by
Foster Alvin D and Foster Esta J
Current Estimated Value
Home Financials for this Owner
Home Financials are based on the most recent Mortgage that was taken out on this home.
Original Mortgage
$90,000
Outstanding Balance
$59,333
Interest Rate
5.11%
Mortgage Type
New Conventional
Estimated Equity
$278,408
Purchase Details
Closed on
May 13, 2009
Sold by
Welch Ronny and Robertson Elizabeth A
Bought by
Frair Belva Randall
Home Financials for this Owner
Home Financials are based on the most recent Mortgage that was taken out on this home.
Original Mortgage
$120,000
Interest Rate
4.84%
Mortgage Type
Seller Take Back
Create a Home Valuation Report for This Property
The Home Valuation Report is an in-depth analysis detailing your home's value as well as a comparison with similar homes in the area
Home Values in the Area
Average Home Value in this Area
Purchase History
| Date | Buyer | Sale Price | Title Company |
|---|---|---|---|
| Foster Alvin D | -- | None Available | |
| Frair Belva Randall | -- | Cole Title Co |
Source: Public Records
Mortgage History
| Date | Status | Borrower | Loan Amount |
|---|---|---|---|
| Open | Foster Alvin D | $90,000 | |
| Previous Owner | Frair Belva Randall | $120,000 |
Source: Public Records
Tax History Compared to Growth
Tax History
| Year | Tax Paid | Tax Assessment Tax Assessment Total Assessment is a certain percentage of the fair market value that is determined by local assessors to be the total taxable value of land and additions on the property. | Land | Improvement |
|---|---|---|---|---|
| 2025 | $2,677 | $343,590 | $50,030 | $293,560 |
| 2024 | $2,677 | $350,580 | $45,050 | $305,530 |
| 2023 | $6,161 | $348,330 | $45,050 | $303,280 |
| 2022 | $6,247 | $311,030 | $43,780 | $267,250 |
| 2021 | $6,349 | $251,220 | $19,150 | $232,070 |
| 2020 | $6,326 | $247,470 | $18,760 | $228,710 |
| 2019 | $6,034 | $230,210 | $18,760 | $211,450 |
| 2018 | $5,478 | $219,870 | $18,760 | $201,110 |
| 2017 | $4,796 | $188,440 | $18,760 | $169,680 |
| 2016 | $4,360 | $170,580 | $18,760 | $151,820 |
| 2015 | -- | $167,360 | $18,120 | $149,240 |
| 2014 | -- | $167,120 | $18,000 | $149,120 |
Source: Public Records
Map
Nearby Homes
- 106 Westwood Ct
- 4 Broadmoor Ct
- 2220 N Village Dr
- 2 Broadmoor Ct
- 2099 Albert Broadfoot St
- 2099 Albert Broadfoot St Unit A
- 408 Rainey St
- 606 Hunter St
- TBD Saint Andrews Ct
- Westside State 121
- 1709 State 121
- 604 State 121
- 2108 Agnew St
- TBD State 121
- 1905 Agnew St
- 108 Leslie St
- 0000 Texas 78
- 5354 S State Highway 78
- 0000 Lee St
- 2023 N Center St
- 2240 N Village Dr
- 2252 N Village Dr
- 2236 N Village Dr
- 2232 N Village Dr
- 2251 N Village Dr
- 2235 N Village Dr
- 2253 N Village Dr
- 2228 N Village Dr
- 00 N Village Unit 2R
- 200 Cypress Point Ct
- 2231 N Village Dr
- 100 Westwood Ct
- 5 Innisbrook Ct
- 4 Innisbrook Ct
- 2224 N Village Dr
- 00 Westwood Ct
- 22R Westwood Ct
- 6 Innisbrook Ct
- 102 Westwood Ct
- 2227 N Village Dr