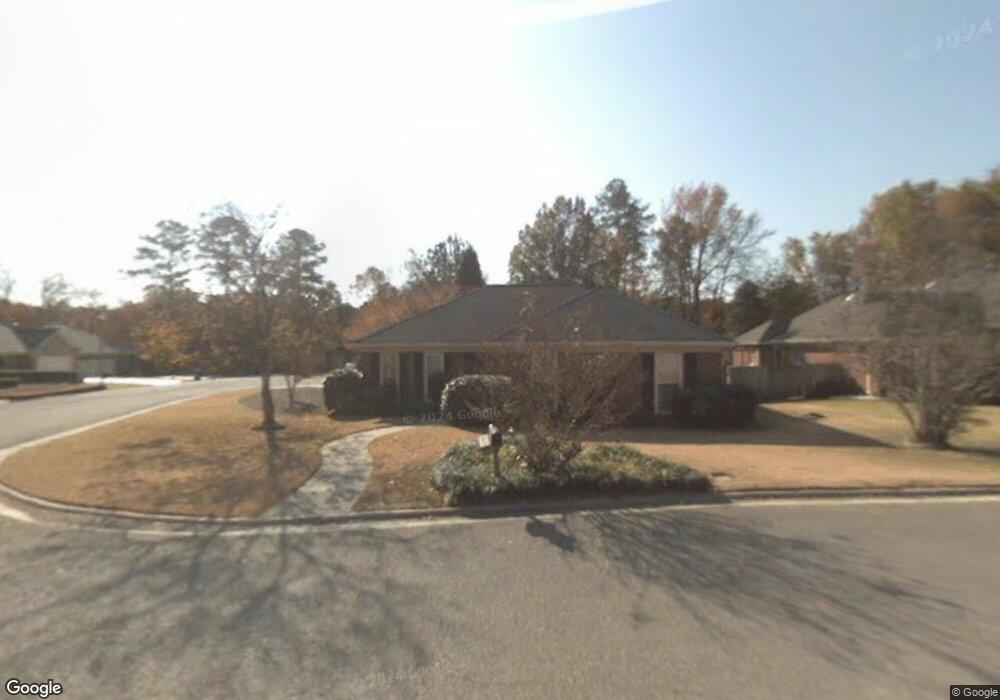
2244 Woodbluff Way Augusta, GA 30909
West Augusta NeighborhoodEstimated Value: $296,916 - $334,000
3
Beds
2
Baths
1,837
Sq Ft
$173/Sq Ft
Est. Value
About This Home
This home is located at 2244 Woodbluff Way, Augusta, GA 30909 and is currently estimated at $317,729, approximately $172 per square foot. 2244 Woodbluff Way is a home located in Richmond County with nearby schools including First Coast Technical Institute, R.B. Hunt Elementary School, and A. Brian Merry Elementary School.
Ownership History
Date
Name
Owned For
Owner Type
Purchase Details
Closed on
Jun 26, 2013
Sold by
Snead Bradford A
Bought by
Dean Cheryl
Current Estimated Value
Home Financials for this Owner
Home Financials are based on the most recent Mortgage that was taken out on this home.
Original Mortgage
$165,925
Outstanding Balance
$117,681
Interest Rate
3.5%
Mortgage Type
FHA
Estimated Equity
$200,048
Purchase Details
Closed on
Jun 3, 2010
Sold by
Hsu Tsung M and Hsu Carolina L
Bought by
Snead Bradford A
Home Financials for this Owner
Home Financials are based on the most recent Mortgage that was taken out on this home.
Original Mortgage
$163,900
Interest Rate
4.38%
Mortgage Type
New Conventional
Purchase Details
Closed on
Jun 12, 2006
Sold by
Ferrone David G and Ferrone Deborah B
Bought by
Hsu Tsung Ming and Lee Carolina
Home Financials for this Owner
Home Financials are based on the most recent Mortgage that was taken out on this home.
Original Mortgage
$179,900
Interest Rate
6.37%
Mortgage Type
Purchase Money Mortgage
Purchase Details
Closed on
Jun 30, 2000
Sold by
Hanna Jeffrey W
Bought by
Ferrone David G and Ferrone Deborah B
Home Financials for this Owner
Home Financials are based on the most recent Mortgage that was taken out on this home.
Original Mortgage
$42,400
Interest Rate
8.63%
Purchase Details
Closed on
Sep 25, 1997
Sold by
Williams Marie Love
Bought by
Williams Joe Calvin
Purchase Details
Closed on
Jul 24, 1997
Sold by
Lane Robert P
Bought by
Williams Joe C
Purchase Details
Closed on
Aug 4, 1992
Sold by
Beasley Douglas O Beasley Shelby P
Bought by
Lane Robert P Lane Anne R
Purchase Details
Closed on
Jul 30, 1992
Sold by
Beasley Douglas O
Bought by
Lane Robert P
Purchase Details
Closed on
Nov 25, 1991
Sold by
Redd Martha E
Bought by
Beasley Douglas O Beasley Shelby P
Purchase Details
Closed on
Nov 21, 1991
Sold by
Redd Martha E
Bought by
Beasley Douglas O
Purchase Details
Closed on
Feb 7, 1991
Sold by
Redd Edgar Terrell and Redd Est
Bought by
Redd Martha Ellis
Purchase Details
Closed on
Sep 10, 1986
Sold by
Jerry W Vaughn Inc Designer Homes
Bought by
Redd Edgar T Sr Redd Martha E
Purchase Details
Closed on
Sep 1, 1986
Sold by
Jerry W Vaughn Inc
Bought by
Redd Edgar T
Create a Home Valuation Report for This Property
The Home Valuation Report is an in-depth analysis detailing your home's value as well as a comparison with similar homes in the area
Home Values in the Area
Average Home Value in this Area
Purchase History
| Date | Buyer | Sale Price | Title Company |
|---|---|---|---|
| Dean Cheryl | $169,000 | -- | |
| Snead Bradford A | $163,900 | -- | |
| Hsu Tsung Ming | $179,900 | None Available | |
| Ferrone David G | $143,900 | -- | |
| Williams Joe Calvin | -- | -- | |
| Williams Joe C | $142,500 | -- | |
| Lane Robert P Lane Anne R | -- | -- | |
| Lane Robert P | $132,000 | -- | |
| Beasley Douglas O Beasley Shelby P | -- | -- | |
| Beasley Douglas O | $125,000 | -- | |
| Redd Martha Ellis | -- | -- | |
| Redd Edgar T Sr Redd Martha E | $104,500 | -- | |
| Redd Edgar T | $104,500 | -- |
Source: Public Records
Mortgage History
| Date | Status | Borrower | Loan Amount |
|---|---|---|---|
| Open | Dean Cheryl | $165,925 | |
| Previous Owner | Snead Bradford A | $163,900 | |
| Previous Owner | Hsu Tsung Ming | $179,900 | |
| Previous Owner | Ferrone David G | $42,400 |
Source: Public Records
Tax History Compared to Growth
Tax History
| Year | Tax Paid | Tax Assessment Tax Assessment Total Assessment is a certain percentage of the fair market value that is determined by local assessors to be the total taxable value of land and additions on the property. | Land | Improvement |
|---|---|---|---|---|
| 2025 | $3,519 | $114,636 | $14,400 | $100,236 |
| 2024 | $3,519 | $110,928 | $14,400 | $96,528 |
| 2023 | $2,500 | $104,388 | $14,400 | $89,988 |
| 2022 | $2,704 | $85,782 | $14,400 | $71,382 |
| 2021 | $2,310 | $67,516 | $14,400 | $53,116 |
| 2020 | $2,281 | $67,516 | $14,400 | $53,116 |
| 2019 | $2,263 | $62,717 | $13,600 | $49,117 |
| 2018 | $2,279 | $62,717 | $13,600 | $49,117 |
| 2017 | $2,245 | $62,717 | $13,600 | $49,117 |
| 2016 | $2,247 | $62,717 | $13,600 | $49,117 |
| 2015 | $2,263 | $62,717 | $13,600 | $49,117 |
| 2014 | $2,470 | $63,960 | $13,600 | $50,360 |
Source: Public Records
Map
Nearby Homes
- 2507 Pinebluff Ct
- 2703 Oakbluff Ct
- 3084 Westwood Rd
- 3082 Westwood Rd
- 3086 Westwood Rd
- 2413 Woodbluff Ct
- 2920 Sussex Rd
- 2914 Westchester Dr
- 3121 Ramsgate Rd
- 3129 Ramsgate Rd
- 503 Sheffield Dr
- 2918 Arrowhead Dr
- 2901 Sussex Rd
- 505 Stratford Dr
- 3129 Edinburgh Dr
- 2924 Mayfair Ct
- 3144 Edinburgh Dr
- 441 Aumond Rd
- 3122 Sussex Rd
- 427 Aumond Rd
- 2246 Woodbluff Way
- 2503 Pinebluff Ct
- 2248 Woodbluff Way
- 2702 Oakbluff Ct
- 2242 Woodbluff Way
- 2504 Pinebluff Ct
- 2229 Woodbluff Way
- 2250 Woodbluff Way
- 2506 Pinebluff Ct
- 2509 Pinebluff Ct
- 2508 Pinebluff Ct
- 2240 Woodbluff Way
- 2701 Oakbluff Ct
- 2238 Woodbluff Way
- 2225 Woodbluff Way
- 2704 Oakbluff Ct
- 2705 Oakbluff Ct
- 2706 Oakbluff Ct
- 2223 Woodbluff Way
- 2236 Woodbluff Way