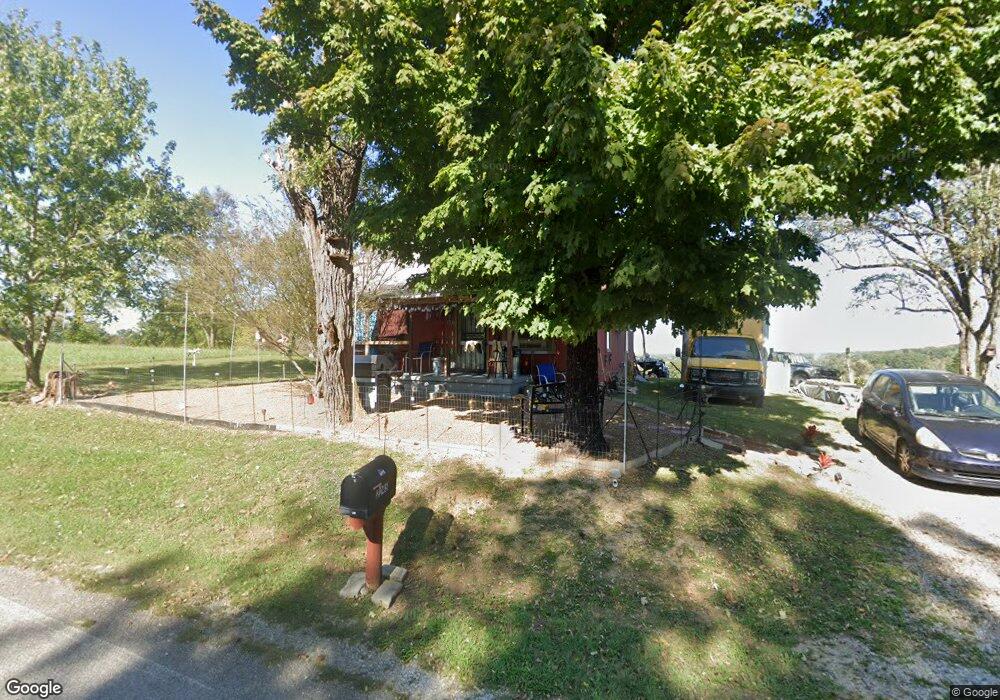
2245 Shipley Rd Cookeville, TN 38501
Estimated Value: $116,632 - $160,000
--
Bed
1
Bath
880
Sq Ft
$165/Sq Ft
Est. Value
About This Home
This home is located at 2245 Shipley Rd, Cookeville, TN 38501 and is currently estimated at $145,211, approximately $165 per square foot. 2245 Shipley Rd is a home located in Putnam County with nearby schools including Cookeville High School, Sycamore Elementary School, and Avery Trace Middle School.
Ownership History
Date
Name
Owned For
Owner Type
Purchase Details
Closed on
Mar 22, 2019
Sold by
Braddom Billy G
Bought by
Thomas Robin and Thomas Adam
Current Estimated Value
Purchase Details
Closed on
Aug 1, 2014
Sold by
Braddom Estelle
Bought by
Webb Tommy Kathy
Purchase Details
Closed on
Feb 15, 1938
Bought by
Braddom Bill
Purchase Details
Closed on
Feb 24, 1937
Create a Home Valuation Report for This Property
The Home Valuation Report is an in-depth analysis detailing your home's value as well as a comparison with similar homes in the area
Home Values in the Area
Average Home Value in this Area
Purchase History
| Date | Buyer | Sale Price | Title Company |
|---|---|---|---|
| Thomas Robin | -- | -- | |
| Wright Heath G | -- | -- | |
| Chaffin Gale Braddom | -- | -- | |
| Webb Tommy Kathy | -- | -- | |
| Braddom Bill | -- | -- | |
| -- | -- | -- |
Source: Public Records
Tax History Compared to Growth
Tax History
| Year | Tax Paid | Tax Assessment Tax Assessment Total Assessment is a certain percentage of the fair market value that is determined by local assessors to be the total taxable value of land and additions on the property. | Land | Improvement |
|---|---|---|---|---|
| 2024 | $433 | $16,275 | $6,100 | $10,175 |
| 2023 | $433 | $16,275 | $6,100 | $10,175 |
| 2022 | $402 | $16,275 | $6,100 | $10,175 |
| 2021 | $402 | $16,275 | $6,100 | $10,175 |
| 2020 | $440 | $16,275 | $6,100 | $10,175 |
| 2019 | $688 | $15,050 | $6,100 | $8,950 |
| 2018 | $642 | $23,525 | $10,150 | $13,375 |
| 2017 | $642 | $23,525 | $10,150 | $13,375 |
| 2016 | $642 | $23,525 | $10,150 | $13,375 |
| 2015 | $660 | $23,525 | $10,150 | $13,375 |
| 2014 | $591 | $21,053 | $0 | $0 |
Source: Public Records
Map
Nearby Homes
- 1190 N Allen Rd
- 1069 Mcgregor Ln
- 1058 Mcgregor Ln
- 2760 Shipley Church Rd
- 00 Dodson Branch Rd
- 1691 Biltmore Dr
- 1398 Shipley Rd
- 1410 Biltmore Cir
- 3112 Shipley Rd
- 23 AC Forrest Rd Tract 1
- 2105 Foster Cir
- 2169 Foster Cir
- 000 Shepherd Hills Rd
- 359 Shepherd Hills Rd
- 155 Kinniard Rd
- 1688 Farmington Dr
- 2280 Woodland Heights
- 3639 Castlebrooke Ln
- 6.39 Ac Shipley Church Rd
- 0 Shipley Church Rd
- 3012 Lane Farm Rd
- 2315 Shipley Rd
- 2142 Shipley Rd
- 2135 Shipley Rd
- 2157 Shipley Rd
- 2121 Shipley Rd
- 2989 Shipley Church Rd
- 3145 Lane Farm Rd
- 2079 Shipley Rd
- 1247 N Allen Rd
- 2342 Shipley Rd
- 2040 Shipley Rd
- 2373 Shipley Rd
- 2055 Shipley Rd
- 1235 N Allen Rd
- 1226 N Allen Rd
- 2024 Shipley Rd
- 2475 Shipley Rd
- 1208 N Allen Rd
- 3200 Kuykendall Rd