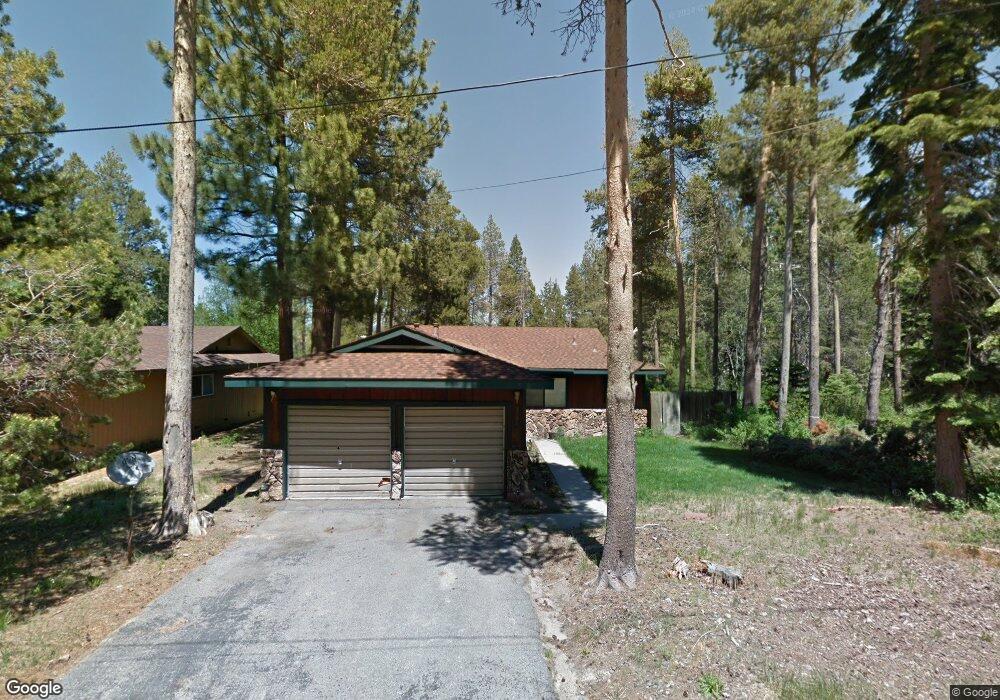
2245 Tahoe Vista Dr South Lake Tahoe, CA 96150
Estimated Value: $627,781 - $711,000
3
Beds
2
Baths
1,293
Sq Ft
$518/Sq Ft
Est. Value
About This Home
This home is located at 2245 Tahoe Vista Dr, South Lake Tahoe, CA 96150 and is currently estimated at $669,195, approximately $517 per square foot. 2245 Tahoe Vista Dr is a home located in El Dorado County with nearby schools including Tahoe Valley Elementary School, South Tahoe Middle School, and South Tahoe High School.
Ownership History
Date
Name
Owned For
Owner Type
Purchase Details
Closed on
Oct 15, 2003
Sold by
Easter Hilda
Bought by
Overfield Lesley
Current Estimated Value
Purchase Details
Closed on
Jan 28, 1999
Sold by
Overfield Lesley P
Bought by
Overfield Lesley and Easter Hilda
Home Financials for this Owner
Home Financials are based on the most recent Mortgage that was taken out on this home.
Original Mortgage
$108,000
Interest Rate
6.73%
Purchase Details
Closed on
Feb 27, 1998
Sold by
Overfield Lesley P and Cox John Webb
Bought by
Overfield Lesley P and Cox John Webb
Purchase Details
Closed on
Oct 3, 1997
Sold by
Overfield Leslie P and Overfield Lesley P
Bought by
Overfield Lesley P and Cox John Webb
Home Financials for this Owner
Home Financials are based on the most recent Mortgage that was taken out on this home.
Original Mortgage
$126,400
Interest Rate
7.54%
Create a Home Valuation Report for This Property
The Home Valuation Report is an in-depth analysis detailing your home's value as well as a comparison with similar homes in the area
Home Values in the Area
Average Home Value in this Area
Purchase History
| Date | Buyer | Sale Price | Title Company |
|---|---|---|---|
| Overfield Lesley | -- | -- | |
| Overfield Lesley | -- | Placer Title Company | |
| Overfield Lesley P | -- | -- | |
| Overfield Lesley P | -- | First American Title Co |
Source: Public Records
Mortgage History
| Date | Status | Borrower | Loan Amount |
|---|---|---|---|
| Previous Owner | Overfield Lesley | $108,000 | |
| Previous Owner | Overfield Lesley P | $126,400 |
Source: Public Records
Tax History Compared to Growth
Tax History
| Year | Tax Paid | Tax Assessment Tax Assessment Total Assessment is a certain percentage of the fair market value that is determined by local assessors to be the total taxable value of land and additions on the property. | Land | Improvement |
|---|---|---|---|---|
| 2025 | $2,357 | $217,572 | $31,358 | $186,214 |
| 2024 | $2,357 | $213,307 | $30,744 | $182,563 |
| 2023 | $2,316 | $209,126 | $30,142 | $178,984 |
| 2022 | $2,294 | $205,026 | $29,551 | $175,475 |
| 2021 | $2,259 | $201,007 | $28,972 | $172,035 |
| 2020 | $2,227 | $198,946 | $28,675 | $170,271 |
| 2019 | $2,216 | $195,046 | $28,113 | $166,933 |
| 2018 | $2,167 | $191,222 | $27,562 | $163,660 |
| 2017 | $2,134 | $187,473 | $27,022 | $160,451 |
| 2016 | $2,091 | $183,798 | $26,493 | $157,305 |
| 2015 | $2,069 | $181,040 | $26,096 | $154,944 |
| 2014 | $1,986 | $177,496 | $25,586 | $151,910 |
Source: Public Records
Map
Nearby Homes
- 2191 Butler Ave
- 741 Tahoe Island Dr
- 724 Tahoe Island Dr
- 2244 Texas Ave
- 2081 Venice Dr Unit 285
- 2081 Venice Dr Unit 280
- 2185 Morro Dr
- 2071 Venice Dr Unit 294
- 569 Lucerne Way
- 552 Christie Dr Unit 307
- 552 Christie Dr Unit 303
- 2031 Venice Dr Unit 322
- 914 Tahoe Island Dr
- 776 Patricia Ln
- 555 Tahoe Keys Blvd Unit 13
- 783 Michael Ct Unit Share B
- 783 Michael Ct
- 803 Michael Dr
- 673 James Ave
- 497 Tahoe Keys Blvd Unit 20
- 2241 Tahoe Vista Dr
- 2237 Tahoe Vista Dr
- 716 Whitney Dr
- 2235 Tahoe Vista Dr
- 2232 Tahoe Vista Dr
- 712 Whitney Dr Unit 2
- 2233 Tahoe Vista Dr
- 2215 Butler Ave
- 2122 Texas Ave
- 2214 Butler Ave
- 725 Whitney Dr
- 719 Whitney Dr
- 2229 Tahoe Vista Dr
- 2224 Tahoe Vista Dr
- 713 Whitney Dr
- 735 Whitney Dr
- 729 Whitney Dr
- 2207 Butler Ave
- 2210 Butler Ave
- 2225 Tahoe Vista Dr