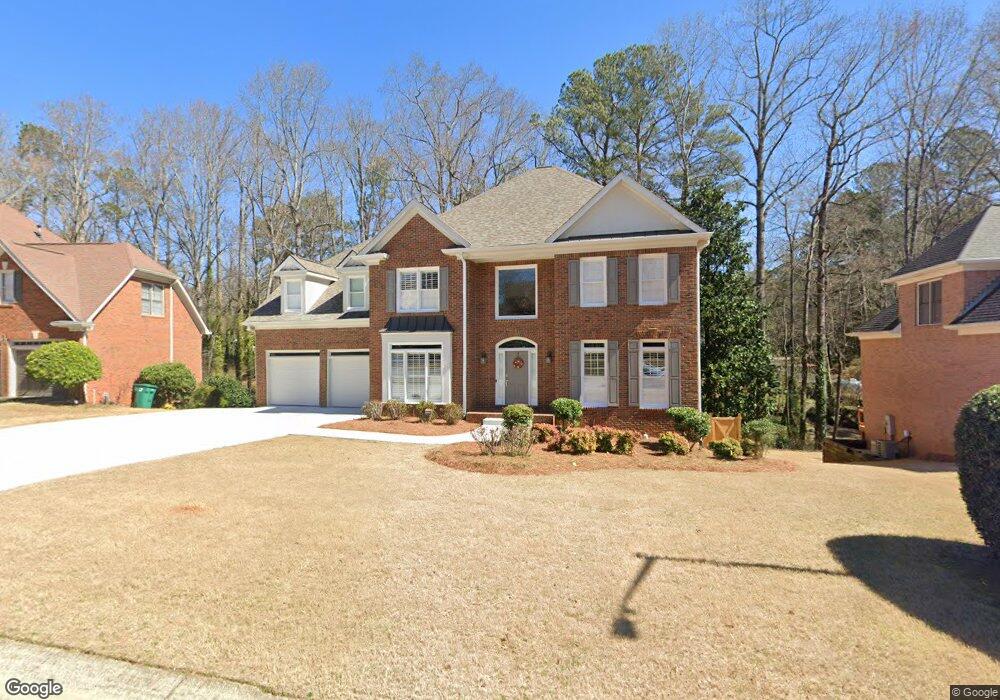
2246 Austin Lake Dr SE Unit 2 Smyrna, GA 30082
Estimated Value: $772,676 - $820,000
4
Beds
3
Baths
3,242
Sq Ft
$245/Sq Ft
Est. Value
About This Home
This home is located at 2246 Austin Lake Dr SE Unit 2, Smyrna, GA 30082 and is currently estimated at $793,919, approximately $244 per square foot. 2246 Austin Lake Dr SE Unit 2 is a home located in Cobb County with nearby schools including King Springs Elementary School, Griffin Middle School, and Campbell High School.
Ownership History
Date
Name
Owned For
Owner Type
Purchase Details
Closed on
Sep 25, 2024
Sold by
Guevara Ignacio and Mount Christopher
Bought by
Menon Neha Raju and Bhattacharjee Rohan
Current Estimated Value
Home Financials for this Owner
Home Financials are based on the most recent Mortgage that was taken out on this home.
Original Mortgage
$325,000
Outstanding Balance
$321,263
Interest Rate
6.35%
Mortgage Type
New Conventional
Estimated Equity
$472,656
Purchase Details
Closed on
Jun 11, 2024
Sold by
Head Ronda and Biwott Reagan
Bought by
Guevara Ignacio and Mount Christopher
Purchase Details
Closed on
Mar 7, 2024
Sold by
Head Ronald William
Bought by
Head Ronda and Biwott Reagan
Purchase Details
Closed on
May 28, 1998
Sold by
Redden Properties Inc
Bought by
Mills Ronald W
Home Financials for this Owner
Home Financials are based on the most recent Mortgage that was taken out on this home.
Original Mortgage
$184,700
Interest Rate
7.15%
Mortgage Type
New Conventional
Create a Home Valuation Report for This Property
The Home Valuation Report is an in-depth analysis detailing your home's value as well as a comparison with similar homes in the area
Home Values in the Area
Average Home Value in this Area
Purchase History
| Date | Buyer | Sale Price | Title Company |
|---|---|---|---|
| Menon Neha Raju | $800,000 | None Listed On Document | |
| Guevara Ignacio | $581,000 | None Listed On Document | |
| Head Ronda | -- | None Listed On Document | |
| Mills Ronald W | $279,900 | -- |
Source: Public Records
Mortgage History
| Date | Status | Borrower | Loan Amount |
|---|---|---|---|
| Open | Menon Neha Raju | $325,000 | |
| Previous Owner | Mills Ronald W | $184,700 |
Source: Public Records
Tax History Compared to Growth
Tax History
| Year | Tax Paid | Tax Assessment Tax Assessment Total Assessment is a certain percentage of the fair market value that is determined by local assessors to be the total taxable value of land and additions on the property. | Land | Improvement |
|---|---|---|---|---|
| 2025 | $7,826 | $298,152 | $80,000 | $218,152 |
| 2024 | $877 | $311,132 | $80,000 | $231,132 |
| 2023 | $725 | $264,072 | $80,000 | $184,072 |
| 2022 | $877 | $189,992 | $36,000 | $153,992 |
| 2021 | $902 | $189,992 | $36,000 | $153,992 |
| 2020 | $902 | $189,992 | $36,000 | $153,992 |
| 2019 | $900 | $176,896 | $32,000 | $144,896 |
| 2018 | $899 | $166,828 | $32,000 | $134,828 |
| 2017 | $723 | $166,828 | $32,000 | $134,828 |
| 2016 | $724 | $147,760 | $32,000 | $115,760 |
| 2015 | $794 | $147,760 | $32,000 | $115,760 |
| 2014 | $822 | $147,760 | $0 | $0 |
Source: Public Records
Map
Nearby Homes
- 3568 Lake Dr SE
- 3538 S Sherwood Rd SE Unit 5
- 3654 Lake Dr SE
- 4222 Terrace Ct SE
- 3462 S Sherwood Rd SE
- 1522 Grace Meadows Ln SE
- 629 Dunton Cir SE
- 982 Oakdale Dr SE
- 3543 S Cobb Dr SE
- 1024 Magnolia Dr SE
- 1019 Magbee Dr SE
- 550 Micayne Cir SE Unit 1
- 538 Micayne Cir SE Unit 3
- 1042 Oakdale Dr SE
- 3844 Lake Dr SE
- 3244 Hampton Ct SE
- 1005 Pinedale Dr SE
- 3375 Emerson St SE
- 2244 Austin Lake Dr SE Unit 2
- 2248 Austin Lake Dr SE
- 2242 Austin Lake Dr SE Unit 2
- 2245 Austin Lake Dr SE Unit 2
- 3528 Lake Dr SE
- 2241 Austin Lake Dr SE
- 3518 Lake Dr SE
- 2239 Austin Lake Dr SE Unit 2
- 2243 Austin Lake Dr SE
- 2240 Austin Lake Dr SE
- 3550 Lake Dr SE
- 756 Park Manor Dr SE
- 756 Park Manor Dr SE
- 760 Park Manor Dr SE
- 2237 Austin Lake Dr SE Unit 2
- 752 Park Manor Dr SE
- 752 Park Manor Dr SE
- 764 Park Manor Dr SE
- 3510 Lake Dr SE
- 748 Park Manor Dr SE