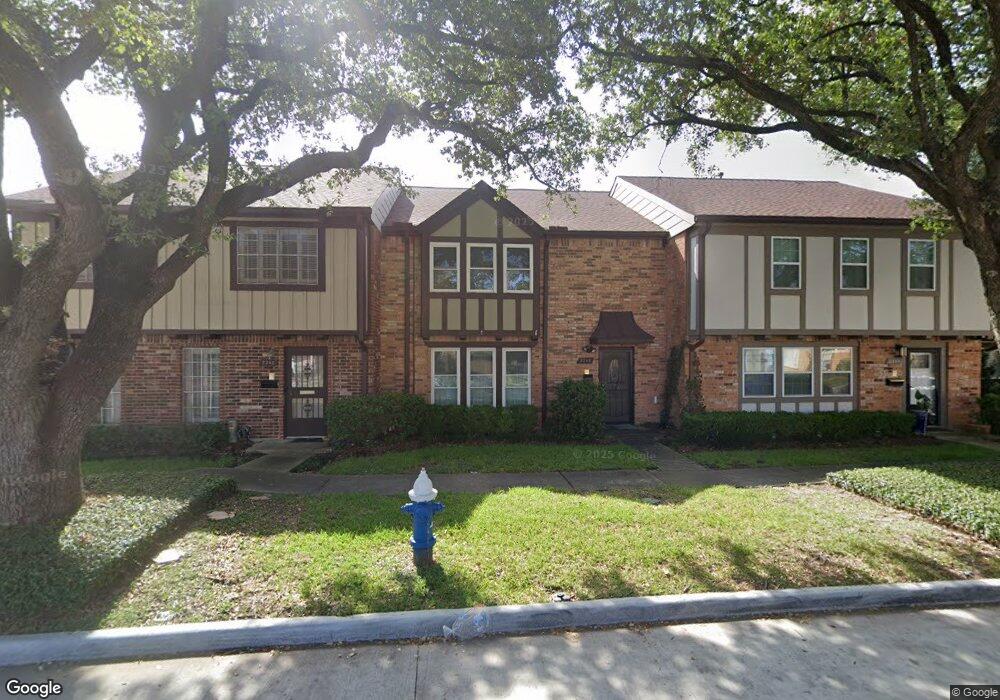
2246 Shadowdale Dr Unit 375 Houston, TX 77043
Spring Shadows NeighborhoodEstimated Value: $208,789 - $222,000
3
Beds
3
Baths
1,924
Sq Ft
$112/Sq Ft
Est. Value
About This Home
This home is located at 2246 Shadowdale Dr Unit 375, Houston, TX 77043 and is currently estimated at $215,197, approximately $111 per square foot. 2246 Shadowdale Dr Unit 375 is a home located in Harris County with nearby schools including Westwood Elementary School, Spring Oaks Middle School, and Spring Woods High School.
Ownership History
Date
Name
Owned For
Owner Type
Purchase Details
Closed on
Sep 15, 2018
Sold by
Lewis Donald J
Bought by
Lewis Darrell Scott
Current Estimated Value
Purchase Details
Closed on
Aug 14, 2001
Sold by
Tran Peter D and Tran Mariane M
Bought by
Lewis Darrell
Home Financials for this Owner
Home Financials are based on the most recent Mortgage that was taken out on this home.
Original Mortgage
$74,000
Interest Rate
7.16%
Purchase Details
Closed on
Sep 4, 1998
Sold by
Truong Peter and Truong Danny
Bought by
Tran Peter D and Tran Mariane M
Home Financials for this Owner
Home Financials are based on the most recent Mortgage that was taken out on this home.
Original Mortgage
$47,500
Interest Rate
6.95%
Create a Home Valuation Report for This Property
The Home Valuation Report is an in-depth analysis detailing your home's value as well as a comparison with similar homes in the area
Home Values in the Area
Average Home Value in this Area
Purchase History
| Date | Buyer | Sale Price | Title Company |
|---|---|---|---|
| Lewis Darrell Scott | -- | None Available | |
| Lewis Darrell | -- | Fidelity National Title | |
| Tran Peter D | -- | First American Title |
Source: Public Records
Mortgage History
| Date | Status | Borrower | Loan Amount |
|---|---|---|---|
| Previous Owner | Lewis Darrell | $74,000 | |
| Previous Owner | Tran Peter D | $47,500 |
Source: Public Records
Tax History Compared to Growth
Tax History
| Year | Tax Paid | Tax Assessment Tax Assessment Total Assessment is a certain percentage of the fair market value that is determined by local assessors to be the total taxable value of land and additions on the property. | Land | Improvement |
|---|---|---|---|---|
| 2025 | $2,493 | $198,233 | $60,000 | $138,233 |
| 2024 | $2,493 | $204,732 | $60,000 | $144,732 |
| 2023 | $2,493 | $190,962 | $60,000 | $130,962 |
| 2022 | $4,078 | $167,275 | $60,000 | $107,275 |
| 2021 | $3,724 | $152,540 | $50,000 | $102,540 |
| 2020 | $3,720 | $161,474 | $50,000 | $111,474 |
| 2019 | $3,528 | $142,968 | $40,000 | $102,968 |
| 2018 | $3,202 | $118,000 | $40,000 | $78,000 |
| 2017 | $2,967 | $118,000 | $40,000 | $78,000 |
| 2016 | $2,697 | $139,879 | $40,000 | $99,879 |
| 2015 | $1,605 | $113,982 | $40,000 | $73,982 |
| 2014 | $1,605 | $85,200 | $20,000 | $65,200 |
Source: Public Records
Map
Nearby Homes
- 2212 Shadowdale Dr Unit 358
- 2252 Shadowdale Dr Unit 362
- 2202 Shadowdale Dr Unit 353
- 2219 Triway Ln Unit 240
- 2233 Triway Ln Unit 267
- 10488 Hammerly Blvd Unit 81
- 10466 Hammerly Blvd Unit 70
- 2603 Durban Dr
- 2614 Manila Ln
- 2342 Triway Ln Unit 147
- 10525 Moorberry Ln
- 2618 Fontana Dr
- 10415 Westray St
- 10382 Hammerly Blvd
- 2019 Shadow Bend Dr
- 2002 Shadow Bend Dr
- 1930 Shadowdale Dr
- 10227 Emnora Ln
- 1919 Shadowdale Dr
- 1930 Chaparral Dr
- 2244 Shadowdale Dr Unit 374
- 2242 Shadowdale Dr Unit 373
- 2248 Shadowdale Dr Unit 376
- 2240 Shadowdale Dr Unit 372
- 2238 Shadowdale Dr Unit 371
- 2236 Shadowdale Dr Unit 370
- 2258 Shadowdale Dr Unit 365
- 2260 Shadowdale Dr Unit 366
- 2262 Shadowdale Dr Unit 367
- 2302 Shadowdale Dr Unit 293
- 2264 Shadowdale Dr Unit 368
- 2256 Shadowdale Dr Unit 364
- 2234 Shadowdale Dr Unit 369
- 2254 Shadowdale Dr Unit 363
- 2304 Shadowdale Dr
- 2250 Shadowdale Dr
- 2306 Shadowdale Dr Unit 291
- 2314 Shadowdale Dr Unit 299
- 2316 Shadowdale Dr Unit 298
- 2216 Shadowdale Dr