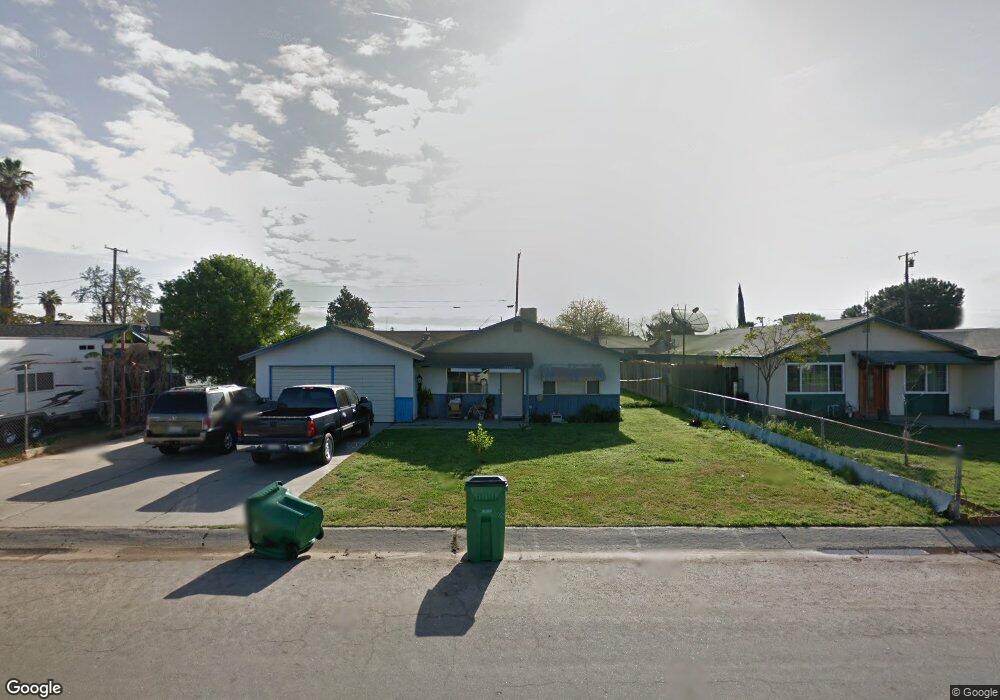
22462 Munson Rd Unit 1 Tulare, CA 93274
Estimated Value: $243,739 - $294,000
4
Beds
3
Baths
1,026
Sq Ft
$269/Sq Ft
Est. Value
About This Home
This home is located at 22462 Munson Rd Unit 1, Tulare, CA 93274 and is currently estimated at $276,435, approximately $269 per square foot. 22462 Munson Rd Unit 1 is a home located in Tulare County with nearby schools including Sundale Elementary School and Mission Oak High School.
Ownership History
Date
Name
Owned For
Owner Type
Purchase Details
Closed on
Aug 1, 2021
Sold by
Cliffwood Llc
Bought by
Bruce A Ourieff Non-Exempt Trust and Martha O Diamond Non-Exempt Trust
Current Estimated Value
Purchase Details
Closed on
Sep 8, 2010
Sold by
Costales Deborah L
Bought by
Costales Daniel
Purchase Details
Closed on
Nov 24, 1997
Sold by
Ortega Reba E
Bought by
Costales Deborah L
Home Financials for this Owner
Home Financials are based on the most recent Mortgage that was taken out on this home.
Original Mortgage
$37,125
Interest Rate
7.19%
Mortgage Type
Purchase Money Mortgage
Purchase Details
Closed on
Jul 5, 1995
Sold by
Ortega Reba E
Bought by
Ortega Reba E
Home Financials for this Owner
Home Financials are based on the most recent Mortgage that was taken out on this home.
Original Mortgage
$28,200
Interest Rate
7.9%
Mortgage Type
Purchase Money Mortgage
Create a Home Valuation Report for This Property
The Home Valuation Report is an in-depth analysis detailing your home's value as well as a comparison with similar homes in the area
Home Values in the Area
Average Home Value in this Area
Purchase History
| Date | Buyer | Sale Price | Title Company |
|---|---|---|---|
| Bruce A Ourieff Non-Exempt Trust | -- | None Listed On Document | |
| Costales Daniel | -- | None Available | |
| Costales Daniel | -- | None Available | |
| Costales Deborah L | $49,500 | -- | |
| Ortega Reba E | -- | -- |
Source: Public Records
Mortgage History
| Date | Status | Borrower | Loan Amount |
|---|---|---|---|
| Previous Owner | Costales Deborah L | $37,125 | |
| Previous Owner | Ortega Reba E | $28,200 |
Source: Public Records
Tax History Compared to Growth
Tax History
| Year | Tax Paid | Tax Assessment Tax Assessment Total Assessment is a certain percentage of the fair market value that is determined by local assessors to be the total taxable value of land and additions on the property. | Land | Improvement |
|---|---|---|---|---|
| 2025 | $860 | $79,036 | $31,932 | $47,104 |
| 2024 | $860 | $77,487 | $31,306 | $46,181 |
| 2023 | $838 | $75,969 | $30,693 | $45,276 |
| 2022 | $814 | $74,481 | $30,092 | $44,389 |
| 2021 | $804 | $73,021 | $29,502 | $43,519 |
| 2020 | $818 | $72,272 | $29,199 | $43,073 |
| 2019 | $839 | $70,854 | $28,626 | $42,228 |
| 2018 | $826 | $69,465 | $28,065 | $41,400 |
| 2017 | $819 | $68,103 | $27,515 | $40,588 |
| 2016 | $787 | $66,767 | $26,975 | $39,792 |
| 2015 | -- | $65,764 | $26,570 | $39,194 |
| 2014 | -- | $64,476 | $26,050 | $38,426 |
Source: Public Records
Map
Nearby Homes
- 13015 Gregory Ave
- 1599 Softwind Dr
- 379 S Oakmore St
- 1797 Clearwater St
- 1849 Softwind Dr
- 1851 Softwind Dr
- 230 Ontario Cir
- 196 Ontario Cir
- 195 Ontario Cir
- 3137 Ryan Ave
- 3131 Ryan Ave
- 3145 Ryan Ave
- 3151 Ryan Ave
- 3162 Ryan Ave
- 3150 Ryan Ave
- 187 Ontario Cir
- 201 Alberta St
- 3043 Parks Ave
- 928 Hidden Ridge
- 3165 E Sierra Ave
- 22472 Munson Rd
- 22450 Munson Rd Unit 1
- 22465 Road 130
- 22457 Road 130
- 22484 Munson Rd
- 22440 Munson Rd Unit 1
- 22473 Road 130
- 22445 Road 130
- 22461 Munson Rd
- 22443 Road 130
- 22449 Munson Rd
- 22433 Road 130
- 22483 Road 130
- 22471 Munson Rd
- 22496 Munson Rd
- 22432 Munson Rd
- 22439 Munson Rd
- 22481 Munson Rd
- 22495 Road 130
- 22425 Road 130