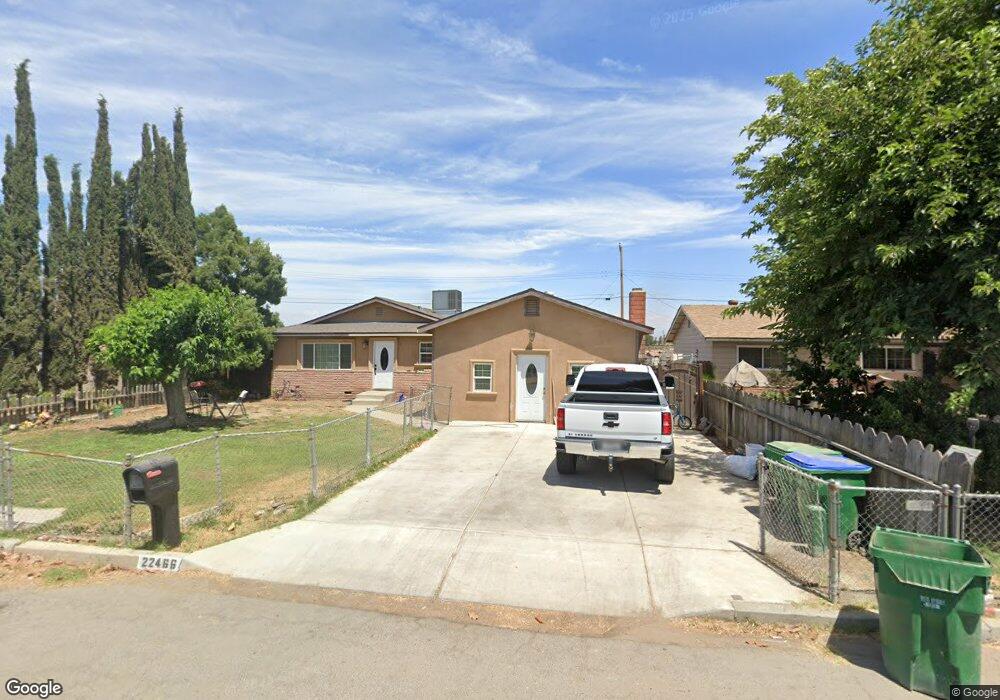
22466 Road 130 Tulare, CA 93274
Estimated Value: $237,000 - $365,000
3
Beds
2
Baths
1,218
Sq Ft
$238/Sq Ft
Est. Value
About This Home
This home is located at 22466 Road 130, Tulare, CA 93274 and is currently estimated at $290,082, approximately $238 per square foot. 22466 Road 130 is a home located in Tulare County with nearby schools including Sundale Elementary School and Mission Oak High School.
Ownership History
Date
Name
Owned For
Owner Type
Purchase Details
Closed on
Jul 24, 2015
Sold by
Enriquez Jose Jesus
Bought by
Enriquez Bertha Alicia
Current Estimated Value
Home Financials for this Owner
Home Financials are based on the most recent Mortgage that was taken out on this home.
Original Mortgage
$25,000
Interest Rate
3.97%
Mortgage Type
Seller Take Back
Purchase Details
Closed on
Jun 11, 2015
Sold by
Earp Leola F
Bought by
Enriquez Bertha Alicia
Home Financials for this Owner
Home Financials are based on the most recent Mortgage that was taken out on this home.
Original Mortgage
$25,000
Interest Rate
3.97%
Mortgage Type
Seller Take Back
Purchase Details
Closed on
Jul 17, 2006
Sold by
Hecker Judith Diane Burnett
Bought by
Earp Ira and Earp Leola
Purchase Details
Closed on
Oct 17, 2001
Sold by
Earp Ira Milton
Bought by
Hecker Judith Diane Burnett
Create a Home Valuation Report for This Property
The Home Valuation Report is an in-depth analysis detailing your home's value as well as a comparison with similar homes in the area
Purchase History
| Date | Buyer | Sale Price | Title Company |
|---|---|---|---|
| Enriquez Bertha Alicia | -- | Chicago Title Company | |
| Enriquez Bertha Alicia | $75,000 | Chicago Title Company | |
| Earp Ira | -- | None Available | |
| Hecker Judith Diane Burnett | -- | -- |
Source: Public Records
Mortgage History
| Date | Status | Borrower | Loan Amount |
|---|---|---|---|
| Previous Owner | Enriquez Bertha Alicia | $25,000 |
Source: Public Records
Tax History
| Year | Tax Paid | Tax Assessment Tax Assessment Total Assessment is a certain percentage of the fair market value that is determined by local assessors to be the total taxable value of land and additions on the property. | Land | Improvement |
|---|---|---|---|---|
| 2025 | $966 | $88,783 | $21,307 | $67,476 |
| 2024 | $966 | $87,043 | $20,890 | $66,153 |
| 2023 | $942 | $85,337 | $20,481 | $64,856 |
| 2022 | $914 | $83,665 | $20,080 | $63,585 |
| 2021 | $903 | $82,024 | $19,686 | $62,338 |
| 2020 | $918 | $81,183 | $19,484 | $61,699 |
| 2019 | $942 | $79,591 | $19,102 | $60,489 |
| 2018 | $928 | $78,030 | $18,727 | $59,303 |
| 2017 | $920 | $76,500 | $18,360 | $58,140 |
| 2016 | $884 | $75,000 | $18,000 | $57,000 |
| 2015 | $1,027 | $87,276 | $24,584 | $62,692 |
| 2014 | $1,012 | $85,566 | $24,102 | $61,464 |
Source: Public Records
Map
Nearby Homes
- 13015 Gregory Ave
- 1727 Softwind Dr
- 1797 Clearwater St
- 3136 E Bardsley Ave
- 230 Ontario Cir
- 195 Ontario Cir
- 3137 Ryan Ave
- 3131 Ryan Ave
- 3157 Ryan Ave
- 3151 Ryan Ave
- 3162 Ryan Ave
- 187 Ontario Cir
- 3043 Parks Ave
- 3165 E Sierra Ave
- 3177 E Sierra Ave
- 928 Hidden Ridge
- 2898 Ship Rock Ct
- 31168 Ryan Ave
- 2896 Channel Reef Ave
- 2790 Harbor Island Ave
- 22456 Road 130
- 22472 Road 130
- 22482 Road 130
- 22446 Road 130
- 22434 Road 130
- 22494 Road 130
- 22465 Road 130
- 22457 Road 130
- 22473 Road 130
- 22445 Road 130
- 22483 Road 130
- 22433 Road 130
- 22508 Road 130
- 22495 Road 130
- 22443 Road 130
- 22426 Road 130
- 22516 Road 130
- 22425 Road 130
- 22462 Munson Rd Unit 1
- 22507 Road 130
Your Personal Tour Guide
Ask me questions while you tour the home.