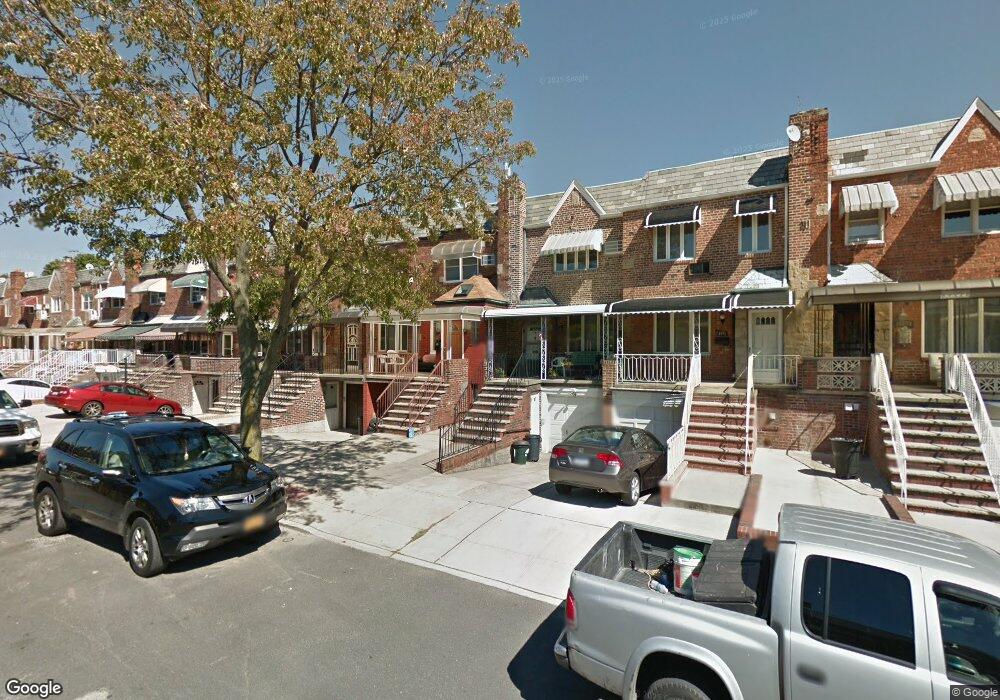
2247 E 28th St Brooklyn, NY 11229
Sheepshead Bay NeighborhoodEstimated Value: $844,000 - $995,000
2
Beds
3
Baths
1,600
Sq Ft
$562/Sq Ft
Est. Value
About This Home
This home is located at 2247 E 28th St, Brooklyn, NY 11229 and is currently estimated at $899,949, approximately $562 per square foot. 2247 E 28th St is a home located in Kings County with nearby schools including Ps 206 Joseph F Lamb, Jhs 14 Shell Bank, and New Visions Charter High School for Advanced Math/ Science.
Ownership History
Date
Name
Owned For
Owner Type
Purchase Details
Closed on
Sep 23, 2020
Sold by
15 Management Llc
Bought by
Leung Wai Mon
Current Estimated Value
Home Financials for this Owner
Home Financials are based on the most recent Mortgage that was taken out on this home.
Original Mortgage
$394,800
Outstanding Balance
$349,562
Interest Rate
2.9%
Mortgage Type
New Conventional
Estimated Equity
$550,387
Purchase Details
Closed on
Jan 6, 2020
Sold by
Yarevska Vita and Yarevskiy Gennadiy
Bought by
15 Management Llc
Purchase Details
Closed on
Sep 14, 2005
Sold by
Palmeri Deborah K
Bought by
Yarevska Vita and Yarevskiy Gennadiy
Home Financials for this Owner
Home Financials are based on the most recent Mortgage that was taken out on this home.
Original Mortgage
$104,200
Interest Rate
5.84%
Create a Home Valuation Report for This Property
The Home Valuation Report is an in-depth analysis detailing your home's value as well as a comparison with similar homes in the area
Home Values in the Area
Average Home Value in this Area
Purchase History
| Date | Buyer | Sale Price | Title Company |
|---|---|---|---|
| Leung Wai Mon | $658,000 | -- | |
| Leung Wai Mon | $658,000 | -- | |
| 15 Management Llc | $500,000 | -- | |
| 15 Management Llc | $500,000 | -- | |
| Yarevska Vita | $521,000 | -- | |
| Yarevska Vita | $521,000 | -- |
Source: Public Records
Mortgage History
| Date | Status | Borrower | Loan Amount |
|---|---|---|---|
| Open | Leung Wai Mon | $394,800 | |
| Closed | Leung Wai Mon | $394,800 | |
| Previous Owner | Yarevska Vita | $104,200 | |
| Previous Owner | Yarevska Vita | $416,800 |
Source: Public Records
Tax History
| Year | Tax Paid | Tax Assessment Tax Assessment Total Assessment is a certain percentage of the fair market value that is determined by local assessors to be the total taxable value of land and additions on the property. | Land | Improvement |
|---|---|---|---|---|
| 2025 | $7,028 | $55,560 | $8,820 | $46,740 |
| 2024 | $7,028 | $47,880 | $8,820 | $39,060 |
| 2023 | $7,053 | $50,460 | $8,820 | $41,640 |
| 2022 | $6,541 | $49,200 | $8,820 | $40,380 |
| 2021 | $6,505 | $51,660 | $8,820 | $42,840 |
| 2020 | $3,051 | $48,660 | $8,820 | $39,840 |
| 2019 | $6,100 | $47,880 | $8,820 | $39,060 |
| 2018 | $5,900 | $28,941 | $6,193 | $22,748 |
| 2017 | $5,566 | $27,303 | $6,453 | $20,850 |
| 2016 | $5,149 | $25,758 | $6,922 | $18,836 |
| 2015 | $3,272 | $24,300 | $9,780 | $14,520 |
| 2014 | $3,272 | $24,300 | $9,780 | $14,520 |
Source: Public Records
Map
Nearby Homes
- 2250 E 29th St
- 2253 E 29th St
- 2229 E 26th St
- 2240 E 26th St
- 2320 E 26th St
- 2366 E 29th St
- 2367 E 28th St
- 2142 E 26th St
- 2138 E 26th St
- 2162 Brown St
- 2711 Avenue X Unit 2G
- 2711 Avenue X Unit 6J
- 2711 Avenue X Unit 1C
- 2711 Avenue X Unit 3K
- 4215 Bedford Ave
- 2133 Haring St Unit 2C
- 2250 E 24th St
- 2127 Haring St
- 4414 Bedford Ave
- 2908 Avenue X
Your Personal Tour Guide
Ask me questions while you tour the home.