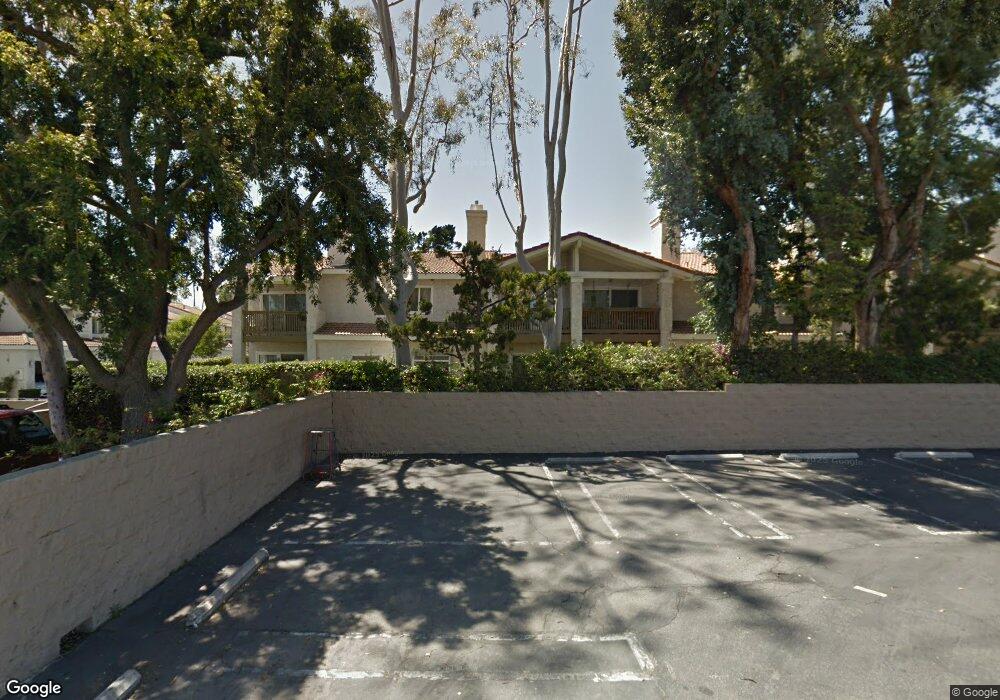
2247 Smoke Tree Ln Ontario, CA 91762
Downtown Ontario NeighborhoodEstimated Value: $491,259 - $549,000
3
Beds
3
Baths
1,346
Sq Ft
$389/Sq Ft
Est. Value
About This Home
This home is located at 2247 Smoke Tree Ln, Ontario, CA 91762 and is currently estimated at $524,065, approximately $389 per square foot. 2247 Smoke Tree Ln is a home located in San Bernardino County with nearby schools including Vista Grande Elementary School, Oaks Middle, and Ontario High School.
Ownership History
Date
Name
Owned For
Owner Type
Purchase Details
Closed on
Jul 19, 2010
Sold by
Zou Eric Yong
Bought by
Tsao Maggie
Current Estimated Value
Purchase Details
Closed on
Jun 21, 2010
Sold by
Ellis Vernett
Bought by
Tsao Maggie
Purchase Details
Closed on
Feb 13, 2003
Sold by
Barton Joshua
Bought by
Ellis Vernett
Home Financials for this Owner
Home Financials are based on the most recent Mortgage that was taken out on this home.
Original Mortgage
$165,000
Interest Rate
5.78%
Purchase Details
Closed on
Jul 13, 2001
Sold by
Wilson Deborah L
Bought by
Barton Joshua and Barton Sabrina
Home Financials for this Owner
Home Financials are based on the most recent Mortgage that was taken out on this home.
Original Mortgage
$123,500
Interest Rate
7.19%
Mortgage Type
FHA
Purchase Details
Closed on
Jun 23, 1994
Sold by
Ingram Tony B
Bought by
Wilson Deborah L
Create a Home Valuation Report for This Property
The Home Valuation Report is an in-depth analysis detailing your home's value as well as a comparison with similar homes in the area
Home Values in the Area
Average Home Value in this Area
Purchase History
| Date | Buyer | Sale Price | Title Company |
|---|---|---|---|
| Tsao Maggie | -- | Fidelity National Title Co | |
| Tsao Maggie | $161,000 | Fidelity National Title Co | |
| Ellis Vernett | $165,000 | Commonwealth Title | |
| Barton Joshua | $130,000 | American Title Co | |
| Wilson Deborah L | $2,500 | -- |
Source: Public Records
Mortgage History
| Date | Status | Borrower | Loan Amount |
|---|---|---|---|
| Previous Owner | Ellis Vernett | $165,000 | |
| Previous Owner | Barton Joshua | $123,500 |
Source: Public Records
Tax History Compared to Growth
Tax History
| Year | Tax Paid | Tax Assessment Tax Assessment Total Assessment is a certain percentage of the fair market value that is determined by local assessors to be the total taxable value of land and additions on the property. | Land | Improvement |
|---|---|---|---|---|
| 2025 | $2,160 | $206,270 | $73,027 | $133,243 |
| 2024 | $2,160 | $202,225 | $71,595 | $130,630 |
| 2023 | $2,099 | $198,260 | $70,191 | $128,069 |
| 2022 | $2,070 | $194,373 | $68,815 | $125,558 |
| 2021 | $2,055 | $190,562 | $67,466 | $123,096 |
| 2020 | $2,019 | $188,608 | $66,774 | $121,834 |
| 2019 | $2,000 | $184,910 | $65,465 | $119,445 |
| 2018 | $1,971 | $181,284 | $64,181 | $117,103 |
| 2017 | $1,900 | $177,730 | $62,923 | $114,807 |
| 2016 | $1,824 | $174,245 | $61,689 | $112,556 |
| 2015 | $1,811 | $171,627 | $60,762 | $110,865 |
| 2014 | $1,754 | $168,265 | $59,572 | $108,693 |
Source: Public Records
Map
Nearby Homes
- 2321 S Magnolia Ave Unit 6E
- 1162 W Philadelphia St
- 12321 Gardenia Place
- 926 W Philadelphia St Unit 49
- 926 W Philadelphia St Unit R99
- 926 W Philadelphia St Unit 10
- 12524 Ross Ave
- 12351 Twin Gables Dr
- 1726 S Mountain Ave Unit C
- 1712 S Mountain Ave Unit E
- 5610 Guardian Way
- 1706 S Mountain Ave
- 12638 Verdugo Ave
- 558 W Philadelphia St
- 2022 S San Antonio Ave
- 6736 Aster Ct
- 6542 Hamilton St
- 6703 Poinsettia Ct
- 12689 Cypress Ave
- 1604 S Mountain Ave Unit D
- 2249 Smoke Tree Ln Unit 34
- 2245 Smoke Tree Ln Unit 32
- 2243 Smoke Tree Ln Unit 31
- 1134 W Whittlers Ln Unit 84
- 2241 Smoke Tree Ln
- 1127 W Whittlers Ln
- 1136 W Whittlers Ln Unit 83
- 1125 W Whittlers Ln Unit 44
- 1123 W Whittlers Ln Unit 43
- 1129 W Whittlers Ln Unit 46
- 2239 Smoke Tree Ln
- 1131 W Whittlers Ln
- 1138 W Whittlers Ln
- 2238 Smoke Tree Ln
- 1133 W Whittlers Ln
- 2236 Smoke Tree Ln
- 1111 W Whittlers Ln Unit 42
- 1111 W Whittlers Ln
- 1144 W Whittlers Ln
- 1135 W Whittlers Ln Unit 49