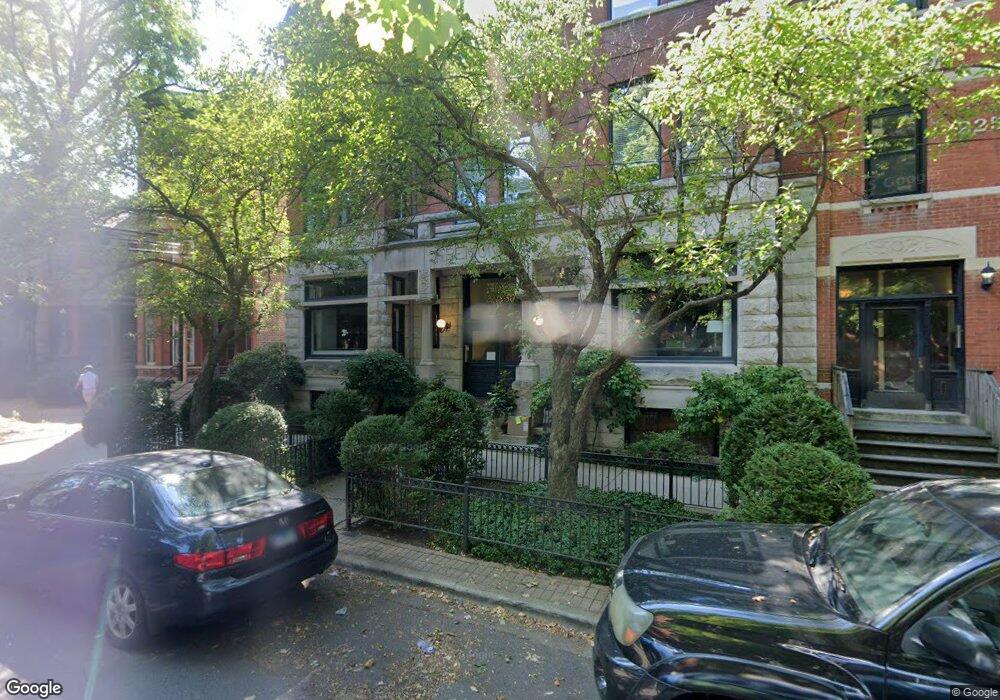
2248 N Fremont St Unit 4 Chicago, IL 60614
Sheffield & DePaul NeighborhoodEstimated Value: $602,000 - $736,000
3
Beds
2
Baths
13,273
Sq Ft
$52/Sq Ft
Est. Value
About This Home
This home is located at 2248 N Fremont St Unit 4, Chicago, IL 60614 and is currently estimated at $695,459, approximately $52 per square foot. 2248 N Fremont St Unit 4 is a home located in Cook County with nearby schools including Mayer Elementary School, Lincoln Park High School, and St. James Lutheran School.
Ownership History
Date
Name
Owned For
Owner Type
Purchase Details
Closed on
Dec 16, 2013
Sold by
Schultz Gregory G and Schultz Donna M
Bought by
Powell Robert W
Current Estimated Value
Purchase Details
Closed on
Jul 6, 2007
Sold by
Kartini Wesson Richard T and Kartini Manshor
Bought by
Schultz Gregory G and Schultz Donna M
Home Financials for this Owner
Home Financials are based on the most recent Mortgage that was taken out on this home.
Original Mortgage
$439,200
Interest Rate
6.76%
Mortgage Type
Purchase Money Mortgage
Purchase Details
Closed on
Apr 7, 2004
Sold by
Benson Eric R and Sayegh Stephanie J
Bought by
Kartini Wesson Richard T and Kartini Manshor
Home Financials for this Owner
Home Financials are based on the most recent Mortgage that was taken out on this home.
Original Mortgage
$352,000
Interest Rate
3.5%
Mortgage Type
Purchase Money Mortgage
Create a Home Valuation Report for This Property
The Home Valuation Report is an in-depth analysis detailing your home's value as well as a comparison with similar homes in the area
Home Values in the Area
Average Home Value in this Area
Purchase History
| Date | Buyer | Sale Price | Title Company |
|---|---|---|---|
| Powell Robert W | -- | Premier Title | |
| Schultz Gregory G | $549,000 | Fort Dearborn Land Title | |
| Kartini Wesson Richard T | $440,000 | Lawyers |
Source: Public Records
Mortgage History
| Date | Status | Borrower | Loan Amount |
|---|---|---|---|
| Previous Owner | Schultz Gregory G | $439,200 | |
| Previous Owner | Kartini Wesson Richard T | $352,000 | |
| Closed | Kartini Wesson Richard T | $44,000 |
Source: Public Records
Tax History Compared to Growth
Tax History
| Year | Tax Paid | Tax Assessment Tax Assessment Total Assessment is a certain percentage of the fair market value that is determined by local assessors to be the total taxable value of land and additions on the property. | Land | Improvement |
|---|---|---|---|---|
| 2024 | $9,712 | $60,990 | $10,489 | $50,501 |
| 2023 | $9,429 | $52,000 | $8,459 | $43,541 |
| 2022 | $9,429 | $52,000 | $8,459 | $43,541 |
| 2021 | $9,251 | $51,998 | $8,458 | $43,540 |
| 2020 | $8,296 | $42,824 | $7,443 | $35,381 |
| 2019 | $8,104 | $46,510 | $7,443 | $39,067 |
| 2018 | $7,966 | $46,510 | $7,443 | $39,067 |
| 2017 | $10,396 | $48,292 | $6,090 | $42,202 |
| 2016 | $9,672 | $48,292 | $6,090 | $42,202 |
| 2015 | $8,849 | $48,292 | $6,090 | $42,202 |
| 2014 | $7,794 | $42,006 | $4,567 | $37,439 |
| 2013 | $7,640 | $42,006 | $4,567 | $37,439 |
Source: Public Records
Map
Nearby Homes
- 907 W Webster Ave
- 2144 N Fremont St
- 734 W Belden Ave Unit 2
- 2107 N Dayton St
- 1013 W Webster Ave Unit 5
- 900 W Fullerton Ave Unit 2J
- 2118 N Sheffield Ave Unit 1
- 2118 N Sheffield Ave Unit 2
- 908 W Fullerton Ave Unit 1
- 908 W Fullerton Ave Unit PH
- 943 W Montana St Unit 3
- 953 W Montana St Unit 1
- 648 W Belden Ave Unit B
- 2209 N Seminary Ave
- 2226 N Lincoln Ave Unit 3A
- 626 W Belden Ave Unit 3
- 845 W Altgeld St Unit 3A
- 917 W Altgeld St Unit 1
- 2403 N Orchard St Unit G
- 2422 N Orchard St
- 2248 N Fremont St Unit 5
- 2248 N Fremont St Unit 1
- 2248 N Fremont St Unit 3
- 2248 N Fremont St Unit 1S
- 2250 N Fremont St Unit 3N
- 2250 N Fremont St Unit 2
- 2250 N Fremont St Unit 6
- 2250 N Fremont St Unit 1N
- 2254 N Fremont St
- 2254 N Fremont St
- 2254 N Fremont St
- 2244 N Fremont St
- 911 W Belden Ave
- 2258 N Fremont St
- 2258 N Fremont St
- 2242 N Fremont St
- 2242 N Fremont St Unit 2
- 913 W Belden Ave
- 913 W Belden Ave
- 913 W Belden Ave Unit 1