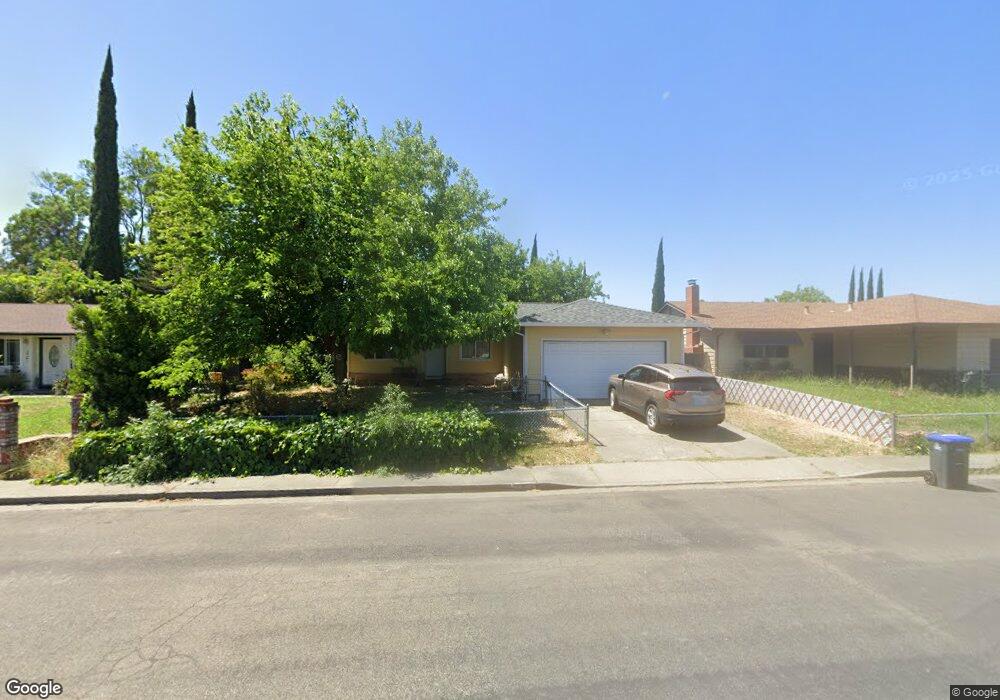
2249 Bellamy Ct Fairfield, CA 94533
Estimated Value: $457,880 - $498,000
4
Beds
2
Baths
1,456
Sq Ft
$330/Sq Ft
Est. Value
About This Home
This home is located at 2249 Bellamy Ct, Fairfield, CA 94533 and is currently estimated at $480,220, approximately $329 per square foot. 2249 Bellamy Ct is a home located in Solano County with nearby schools including Tolenas Academy of Music & Media, Grange Middle School, and Fairfield High School.
Ownership History
Date
Name
Owned For
Owner Type
Purchase Details
Closed on
Jul 24, 2020
Sold by
Herrera Pablo
Bought by
Herrera Pablo and Chavira Maria Hayde
Current Estimated Value
Purchase Details
Closed on
Apr 30, 2012
Sold by
Gonzalez Martin Herrera and Herrera Martin
Bought by
Herrera Pablo
Purchase Details
Closed on
Jun 22, 1999
Sold by
Secty Of Veterans Affairs
Bought by
Herrera Martin and Herrera Pablo
Home Financials for this Owner
Home Financials are based on the most recent Mortgage that was taken out on this home.
Original Mortgage
$116,055
Outstanding Balance
$30,608
Interest Rate
7.05%
Mortgage Type
Seller Take Back
Estimated Equity
$449,613
Purchase Details
Closed on
Nov 26, 1997
Sold by
Johnson William R and Johnson S K
Bought by
Countrywide Funding Corp
Purchase Details
Closed on
Nov 25, 1997
Sold by
Countrywide Home Loans Inc
Bought by
Va
Purchase Details
Closed on
Jan 24, 1994
Sold by
Johnson William Rufus and Johnson Rufus
Bought by
Johnson William Rufus and Johnson Sheila Kay
Home Financials for this Owner
Home Financials are based on the most recent Mortgage that was taken out on this home.
Original Mortgage
$135,978
Interest Rate
7.1%
Mortgage Type
Assumption
Create a Home Valuation Report for This Property
The Home Valuation Report is an in-depth analysis detailing your home's value as well as a comparison with similar homes in the area
Home Values in the Area
Average Home Value in this Area
Purchase History
| Date | Buyer | Sale Price | Title Company |
|---|---|---|---|
| Herrera Pablo | -- | None Available | |
| Herrera Pablo | -- | None Available | |
| Herrera Martin | $129,000 | -- | |
| Countrywide Funding Corp | $90,783 | -- | |
| Va | -- | -- | |
| Johnson William Rufus | -- | Fidelity National Title |
Source: Public Records
Mortgage History
| Date | Status | Borrower | Loan Amount |
|---|---|---|---|
| Open | Herrera Martin | $116,055 | |
| Previous Owner | Johnson William Rufus | $135,978 |
Source: Public Records
Tax History
| Year | Tax Paid | Tax Assessment Tax Assessment Total Assessment is a certain percentage of the fair market value that is determined by local assessors to be the total taxable value of land and additions on the property. | Land | Improvement |
|---|---|---|---|---|
| 2025 | $2,271 | $201,590 | $69,027 | $132,563 |
| 2024 | $2,271 | $197,638 | $67,674 | $129,964 |
| 2023 | $2,201 | $193,764 | $66,348 | $127,416 |
| 2022 | $2,175 | $189,966 | $65,049 | $124,917 |
| 2021 | $2,153 | $186,242 | $63,774 | $122,468 |
| 2020 | $2,103 | $184,334 | $63,121 | $121,213 |
| 2019 | $2,052 | $180,721 | $61,884 | $118,837 |
| 2018 | $2,118 | $177,178 | $60,671 | $116,507 |
| 2017 | $2,021 | $173,705 | $59,482 | $114,223 |
| 2016 | $2,000 | $170,300 | $58,316 | $111,984 |
| 2015 | $1,867 | $167,743 | $57,441 | $110,302 |
| 2014 | $1,851 | $164,458 | $56,316 | $108,142 |
Source: Public Records
Map
Nearby Homes
- 2059 Tilden Ct
- 2076 Harte Ct
- 2321 Channing Place
- 1584 Davis Ct
- 121 Century Ct
- 102 Royal Oak Ct
- 1476 Monument Ln
- 1488 Monument Ln
- 1464 Descanso Ln
- 86 Biltmore Ct
- 1492 Monument Ln
- 1312 Sutter Ct
- 175 Palm Beach Ct
- 1213 Sprig Ct
- 1328 Horizon Cir
- 1552 Millennium Way
- 1520 Millennium Way
- 1516 Millennium Way
- 1512 Millennium Way
- 1508 Millennium Way
- 2241 Bellamy Ct
- 2250 Fremont Ct
- 2242 Fremont Ct
- 2258 Fremont Ct
- 2265 Bellamy Ct
- 2266 Fremont Ct
- 2248 Bellamy Ct Unit 15
- 2240 Bellamy Ct
- 2273 Bellamy Ct
- 2256 Bellamy Ct
- 2196 Tilden Place
- 2264 Bellamy Ct
- 2175 Ellington Place
- 2281 Bellamy Ct
- 2247 Fremont Ct
- 2247 Carver Place
- 2239 Carver Place
- 2255 Fremont Ct
Your Personal Tour Guide
Ask me questions while you tour the home.