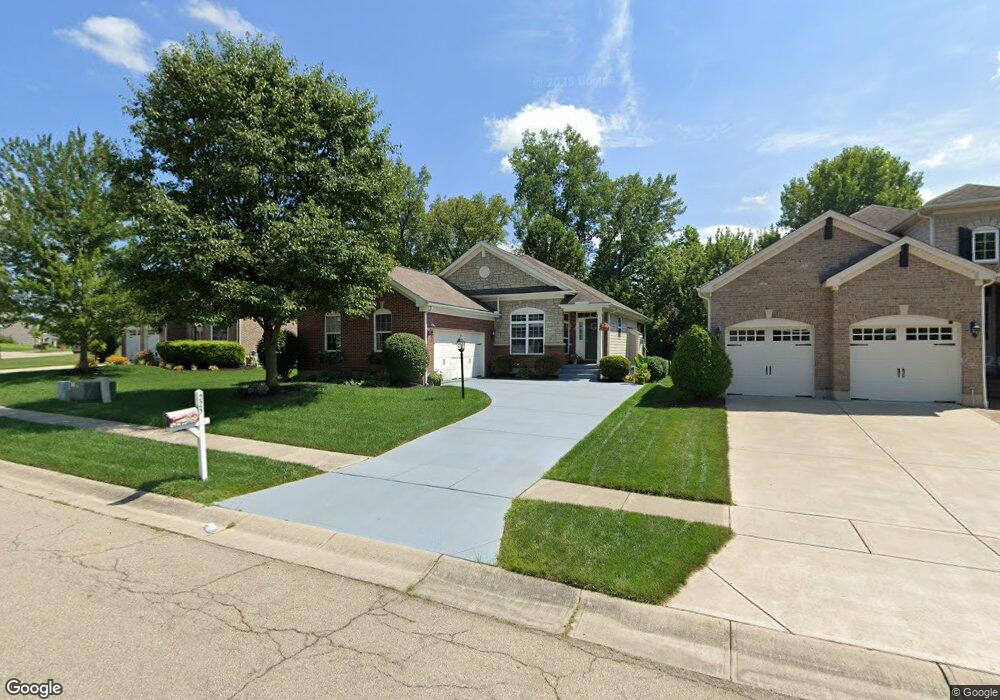
225 Bailey Ln Springboro, OH 45066
Estimated Value: $396,000 - $489,000
2
Beds
3
Baths
1,627
Sq Ft
$268/Sq Ft
Est. Value
About This Home
This home is located at 225 Bailey Ln, Springboro, OH 45066 and is currently estimated at $435,700, approximately $267 per square foot. 225 Bailey Ln is a home located in Warren County with nearby schools including Clearcreek Elementary School, Springboro Intermediate School, and Dennis Elementary School.
Ownership History
Date
Name
Owned For
Owner Type
Purchase Details
Closed on
May 10, 2007
Sold by
The Drees Co
Bought by
Ginter Marlene A
Current Estimated Value
Home Financials for this Owner
Home Financials are based on the most recent Mortgage that was taken out on this home.
Original Mortgage
$228,800
Interest Rate
6.22%
Mortgage Type
Purchase Money Mortgage
Purchase Details
Closed on
Dec 7, 2006
Sold by
Lifetime Development Llc
Bought by
The Drees Co
Create a Home Valuation Report for This Property
The Home Valuation Report is an in-depth analysis detailing your home's value as well as a comparison with similar homes in the area
Home Values in the Area
Average Home Value in this Area
Purchase History
| Date | Buyer | Sale Price | Title Company |
|---|---|---|---|
| Ginter Marlene A | $286,200 | Prominent Title Agency | |
| The Drees Co | $65,500 | None Available |
Source: Public Records
Mortgage History
| Date | Status | Borrower | Loan Amount |
|---|---|---|---|
| Previous Owner | Ginter Marlene A | $228,800 |
Source: Public Records
Tax History
| Year | Tax Paid | Tax Assessment Tax Assessment Total Assessment is a certain percentage of the fair market value that is determined by local assessors to be the total taxable value of land and additions on the property. | Land | Improvement |
|---|---|---|---|---|
| 2025 | $4,928 | $126,190 | $35,000 | $91,190 |
| 2024 | $4,928 | $126,190 | $35,000 | $91,190 |
| 2023 | $4,545 | $106,718 | $25,830 | $80,888 |
| 2022 | $4,478 | $106,719 | $25,830 | $80,889 |
| 2021 | $4,167 | $106,719 | $25,830 | $80,889 |
| 2020 | $3,875 | $86,762 | $21,000 | $65,762 |
| 2019 | $3,573 | $86,762 | $21,000 | $65,762 |
| 2018 | $3,575 | $86,762 | $21,000 | $65,762 |
| 2017 | $3,826 | $83,629 | $20,549 | $63,081 |
| 2016 | $3,990 | $83,629 | $20,549 | $63,081 |
| 2015 | $4,329 | $83,629 | $20,549 | $63,081 |
| 2014 | $4,329 | $85,770 | $19,950 | $65,820 |
| 2013 | $4,326 | $90,290 | $21,000 | $69,290 |
Source: Public Records
Map
Nearby Homes
- 7 W Long Meadow Dr
- 50 Morris St
- 45 Morris St Unit 15
- 8 Glasgow St Unit 30
- 65 Morris St Unit 17
- 45 Morris St
- 18 Glasgow St Unit 29
- 8 Glasgow St
- 18 Glasgow St
- 30 Morris St
- 50 Morris St Unit 4
- 65 Morris St
- 20 Inverness Ct
- 210 Dan Haven Bend
- 60 Rosewood Dr
- 175 Farmridge Rd
- 25 Morris St
- 25 Morris St Unit 13
- 330 East St
- 84 W Mill St
Your Personal Tour Guide
Ask me questions while you tour the home.