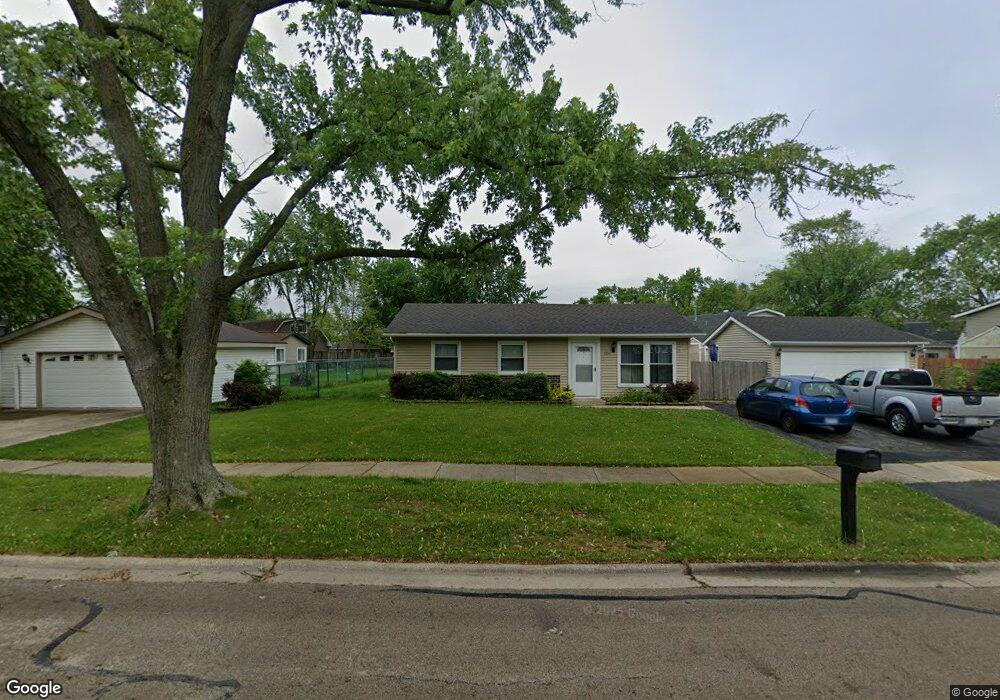
225 Bristol Way Bolingbrook, IL 60440
Poplar Park NeighborhoodEstimated Value: $255,000 - $286,000
3
Beds
1
Bath
962
Sq Ft
$282/Sq Ft
Est. Value
About This Home
This home is located at 225 Bristol Way, Bolingbrook, IL 60440 and is currently estimated at $271,065, approximately $281 per square foot. 225 Bristol Way is a home located in Will County with nearby schools including Independence Elementary School, Jane Addams Middle School, and Brooks Middle School.
Ownership History
Date
Name
Owned For
Owner Type
Purchase Details
Closed on
Mar 17, 2017
Sold by
Czepek Todd R and Neiryck Theresa R
Bought by
Shea Jeannine A
Current Estimated Value
Home Financials for this Owner
Home Financials are based on the most recent Mortgage that was taken out on this home.
Original Mortgage
$113,600
Outstanding Balance
$96,295
Interest Rate
5%
Mortgage Type
New Conventional
Estimated Equity
$174,770
Purchase Details
Closed on
Oct 26, 2004
Sold by
Troha Nancy and Uribe Nancy Ann
Bought by
Czepek Todd R and Neirynck Theresa R
Home Financials for this Owner
Home Financials are based on the most recent Mortgage that was taken out on this home.
Original Mortgage
$131,920
Interest Rate
5.82%
Mortgage Type
Purchase Money Mortgage
Purchase Details
Closed on
Jun 28, 2002
Sold by
Starr Joseph P and Starr Rebecca R
Bought by
Cribe Nancy Ann
Home Financials for this Owner
Home Financials are based on the most recent Mortgage that was taken out on this home.
Original Mortgage
$107,200
Interest Rate
6.79%
Create a Home Valuation Report for This Property
The Home Valuation Report is an in-depth analysis detailing your home's value as well as a comparison with similar homes in the area
Home Values in the Area
Average Home Value in this Area
Purchase History
| Date | Buyer | Sale Price | Title Company |
|---|---|---|---|
| Shea Jeannine A | $142,000 | Attorney | |
| Czepek Todd R | $165,000 | Atg | |
| Cribe Nancy Ann | $134,000 | -- |
Source: Public Records
Mortgage History
| Date | Status | Borrower | Loan Amount |
|---|---|---|---|
| Open | Shea Jeannine A | $113,600 | |
| Previous Owner | Czepek Todd R | $131,920 | |
| Previous Owner | Cribe Nancy Ann | $107,200 |
Source: Public Records
Tax History Compared to Growth
Tax History
| Year | Tax Paid | Tax Assessment Tax Assessment Total Assessment is a certain percentage of the fair market value that is determined by local assessors to be the total taxable value of land and additions on the property. | Land | Improvement |
|---|---|---|---|---|
| 2024 | $5,792 | $70,711 | $18,635 | $52,076 |
| 2023 | $5,792 | $63,623 | $16,767 | $46,856 |
| 2022 | $4,965 | $56,235 | $14,820 | $41,415 |
| 2021 | $4,690 | $52,581 | $13,857 | $38,724 |
| 2020 | $4,537 | $50,852 | $13,401 | $37,451 |
| 2019 | $4,378 | $48,431 | $12,763 | $35,668 |
| 2018 | $4,050 | $44,996 | $11,858 | $33,138 |
| 2017 | $3,841 | $42,650 | $11,240 | $31,410 |
| 2016 | $3,716 | $40,600 | $10,700 | $29,900 |
| 2015 | $3,274 | $39,000 | $10,300 | $28,700 |
| 2014 | $3,274 | $35,500 | $9,400 | $26,100 |
| 2013 | $3,274 | $37,400 | $9,900 | $27,500 |
Source: Public Records
Map
Nearby Homes
- 257 Plainview Dr
- 836 Lily Cache Ln
- 4 Claridge Ct
- 304 Claridge Cir
- 112 S Orchard Dr
- 157 N Orchard Dr
- 109 Commonwealth Dr
- 207 Hampdon Ct
- 20 Lily Ct
- 156 Glen Lake Dr
- 206 Christine Way Unit 2
- 1103 Lily Field Ln
- 1086 Lily Field Ln
- 238 Paddington Ln
- 164 Galewood Dr
- 118 Springleaf Dr Unit 5
- 129 Galewood Dr
- 6 Copper Ct
- 141 Campbell Dr
- V Lily Cache Ln
- 221 Bristol Way
- 235 Bristol Ct
- 264 Waterman Dr
- 233 Bristol Ct
- 268 Waterman Dr
- 237 Bristol Ct
- 224 Bristol Way
- 228 Bristol Way
- 220 Bristol Way
- 244 Waterman Dr
- 232 Bristol Way
- 272 Waterman Dr
- 236 Bristol Way
- 239 Bristol Ct
- 255 Waterman Dr
- 240 Waterman Dr
- 263 Waterman Dr
- 276 Waterman Dr
- 251 Waterman Dr Unit 5
- 245 Bristol Ct