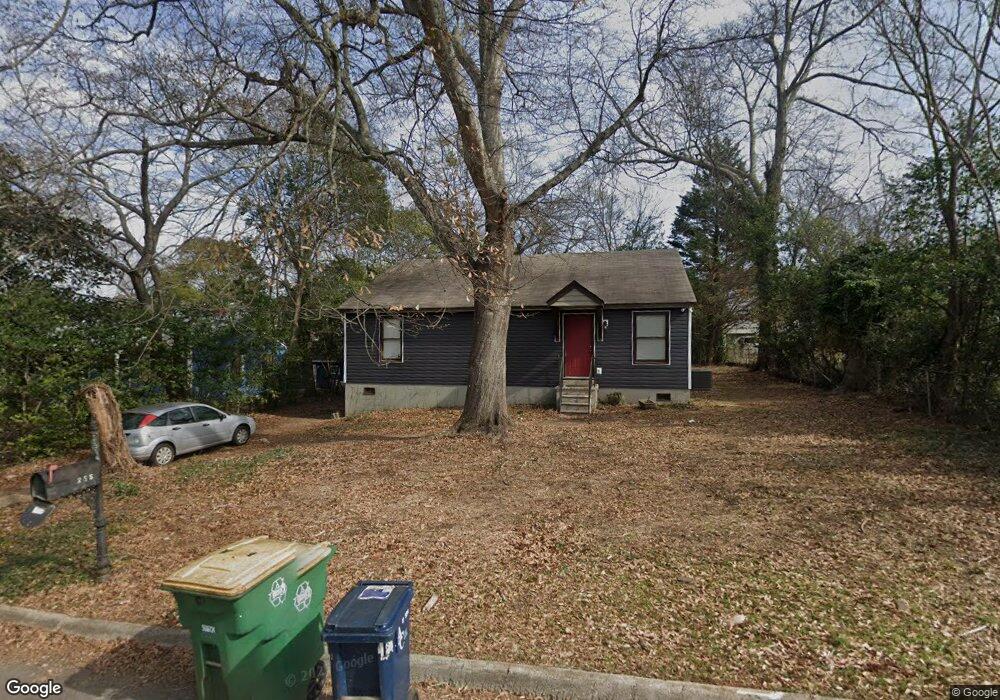
225 Clover St Athens, GA 30606
Normaltown NeighborhoodEstimated Value: $430,000 - $471,208
3
Beds
2
Baths
1,394
Sq Ft
$321/Sq Ft
Est. Value
About This Home
This home is located at 225 Clover St, Athens, GA 30606 and is currently estimated at $447,552, approximately $321 per square foot. 225 Clover St is a home located in Clarke County with nearby schools including Johnnie Lay Burks Elementary School, Clarke Middle School, and Clarke Central High School.
Ownership History
Date
Name
Owned For
Owner Type
Purchase Details
Closed on
Nov 4, 2015
Sold by
Wilson Joanne
Bought by
Fernandes John
Current Estimated Value
Home Financials for this Owner
Home Financials are based on the most recent Mortgage that was taken out on this home.
Original Mortgage
$110,000
Outstanding Balance
$86,491
Interest Rate
3.78%
Mortgage Type
New Conventional
Estimated Equity
$361,061
Purchase Details
Closed on
Jun 11, 2013
Sold by
Lumpkin James Q
Bought by
Wilson Joanne
Home Financials for this Owner
Home Financials are based on the most recent Mortgage that was taken out on this home.
Original Mortgage
$108,000
Interest Rate
3.53%
Mortgage Type
New Conventional
Purchase Details
Closed on
Nov 4, 2003
Sold by
Lavender S Blake
Bought by
Lumpkin James Q
Purchase Details
Closed on
Mar 14, 2000
Sold by
Mccannon Jimmy Ray
Bought by
Lavender S Blake
Purchase Details
Closed on
Jul 24, 1997
Sold by
Mccannon Mary Kristi and Jimmy Ray
Bought by
Mccannon Jimmy Ray
Purchase Details
Closed on
Jan 21, 1997
Sold by
Bledsoe Ivey E and Bledsoe Bledsoe
Bought by
Mccannon Mary Kristi and Jimmy Ray
Purchase Details
Closed on
Sep 16, 1992
Sold by
Sutton Elizabeth A
Bought by
Bledsoe Ivey E and Bledsoe Bledsoe
Create a Home Valuation Report for This Property
The Home Valuation Report is an in-depth analysis detailing your home's value as well as a comparison with similar homes in the area
Home Values in the Area
Average Home Value in this Area
Purchase History
| Date | Buyer | Sale Price | Title Company |
|---|---|---|---|
| Fernandes John | $150,000 | -- | |
| Wilson Joanne | $135,000 | -- | |
| Lumpkin James Q | $120,000 | -- | |
| Lavender S Blake | $22,500 | -- | |
| Mccannon Jimmy Ray | -- | -- | |
| Mccannon Mary Kristi | $73,500 | -- | |
| Bledsoe Ivey E | $51,000 | -- |
Source: Public Records
Mortgage History
| Date | Status | Borrower | Loan Amount |
|---|---|---|---|
| Open | Fernandes John | $110,000 | |
| Previous Owner | Wilson Joanne | $108,000 |
Source: Public Records
Tax History Compared to Growth
Tax History
| Year | Tax Paid | Tax Assessment Tax Assessment Total Assessment is a certain percentage of the fair market value that is determined by local assessors to be the total taxable value of land and additions on the property. | Land | Improvement |
|---|---|---|---|---|
| 2024 | $5,593 | $162,682 | $40,000 | $122,682 |
| 2023 | $5,084 | $143,114 | $36,000 | $107,114 |
| 2022 | $3,793 | $118,907 | $36,000 | $82,907 |
| 2021 | $3,307 | $98,134 | $36,000 | $62,134 |
| 2020 | $2,946 | $87,418 | $32,000 | $55,418 |
| 2019 | $2,735 | $80,551 | $26,000 | $54,551 |
| 2018 | $2,676 | $78,818 | $26,000 | $52,818 |
| 2017 | $2,175 | $64,052 | $16,000 | $48,052 |
| 2016 | $2,035 | $59,934 | $16,000 | $43,934 |
| 2015 | $1,871 | $55,033 | $14,000 | $41,033 |
| 2014 | $1,839 | $54,375 | $14,000 | $40,375 |
Source: Public Records
Map
Nearby Homes