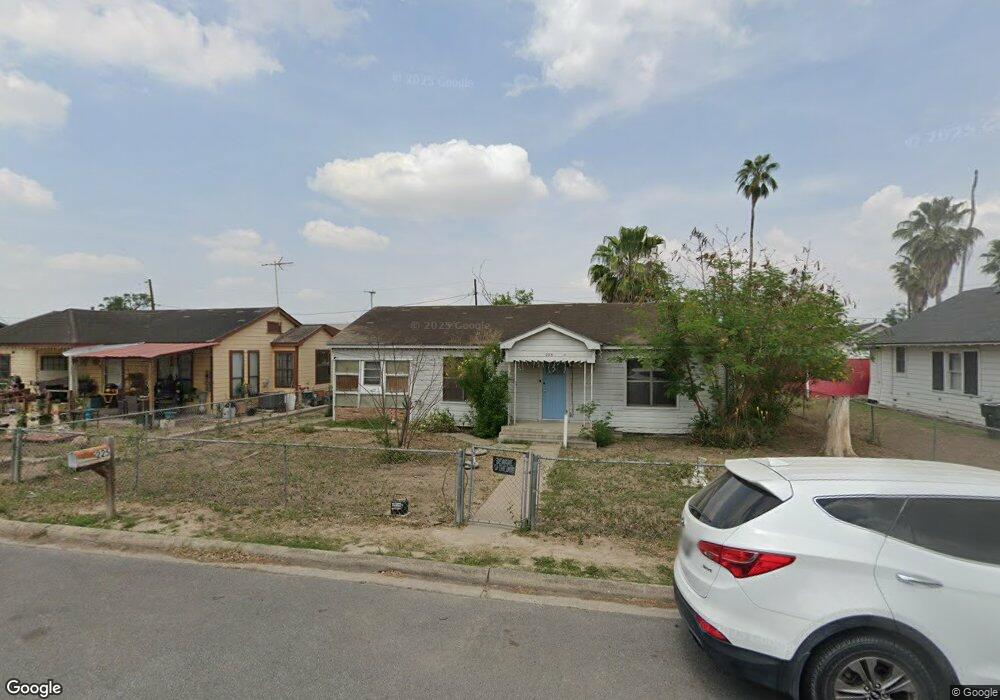
225 E 7th St San Juan, TX 78589
Estimated Value: $114,274 - $182,000
3
Beds
2
Baths
1,056
Sq Ft
$131/Sq Ft
Est. Value
About This Home
This home is located at 225 E 7th St, San Juan, TX 78589 and is currently estimated at $138,758, approximately $131 per square foot. 225 E 7th St is a home located in Hidalgo County with nearby schools including Alfred Sorensen Elementary, Stephen F. Austin Middle School, and PSJA Early College High School.
Ownership History
Date
Name
Owned For
Owner Type
Purchase Details
Closed on
Feb 10, 2014
Sold by
Schwichtenberg Rental Properties Llc
Bought by
Gorham Carlos R
Current Estimated Value
Home Financials for this Owner
Home Financials are based on the most recent Mortgage that was taken out on this home.
Original Mortgage
$43,000
Outstanding Balance
$32,768
Interest Rate
4.56%
Mortgage Type
New Conventional
Estimated Equity
$105,990
Purchase Details
Closed on
Jan 20, 2014
Sold by
Fambro Dianne D and Boyer Marshall
Bought by
Schwichtenberg Rental Properties Llc
Home Financials for this Owner
Home Financials are based on the most recent Mortgage that was taken out on this home.
Original Mortgage
$43,000
Outstanding Balance
$32,768
Interest Rate
4.56%
Mortgage Type
New Conventional
Estimated Equity
$105,990
Purchase Details
Closed on
Aug 20, 2013
Sold by
Fambro Dianne D and Boyer Marshall
Bought by
Fambro Dianne D and Boyer Marshall
Create a Home Valuation Report for This Property
The Home Valuation Report is an in-depth analysis detailing your home's value as well as a comparison with similar homes in the area
Home Values in the Area
Average Home Value in this Area
Purchase History
| Date | Buyer | Sale Price | Title Company |
|---|---|---|---|
| Gorham Carlos R | -- | Sierra Title | |
| Schwichtenberg Rental Properties Llc | -- | Sierra Title | |
| Fambro Dianne D | -- | None Available |
Source: Public Records
Mortgage History
| Date | Status | Borrower | Loan Amount |
|---|---|---|---|
| Open | Gorham Carlos R | $43,000 |
Source: Public Records
Tax History
| Year | Tax Paid | Tax Assessment Tax Assessment Total Assessment is a certain percentage of the fair market value that is determined by local assessors to be the total taxable value of land and additions on the property. | Land | Improvement |
|---|---|---|---|---|
| 2025 | $1,208 | $78,710 | $44,280 | $34,430 |
| 2024 | $1,208 | $84,801 | $44,280 | $40,521 |
| 2023 | $2,196 | $84,801 | $44,280 | $40,521 |
| 2022 | $1,617 | $58,495 | $22,680 | $35,815 |
| 2021 | $1,474 | $52,162 | $22,680 | $29,482 |
| 2020 | $1,339 | $46,568 | $22,680 | $23,888 |
| 2019 | $1,136 | $38,116 | $19,800 | $18,316 |
| 2018 | $1,143 | $38,116 | $19,800 | $18,316 |
| 2017 | $1,150 | $38,116 | $19,800 | $18,316 |
| 2016 | $962 | $31,893 | $14,400 | $17,493 |
| 2015 | $1,020 | $31,893 | $14,400 | $17,493 |
Source: Public Records
Map
Nearby Homes
- 304 E 6th St
- 622 S Nebraska Ave
- 312 E 10th St
- 205 E 11th St
- 91 San Juan
- 1009 S Nebraska Ave
- 905 S Lincoln Ave
- 204 E 4th St
- 211 W 8th St
- 222 W 7th St
- 412 Zapata St
- 423 E Railroad St
- 1214 S Ohio Ave
- 319 E 3rd St
- 600 S Standard Ave
- 321 E 3rd St
- 323 E 3rd St
- 1223 Ohio Ave
- 901 S Stewart Rd Unit 5
- 901 S Stewart Rd
Your Personal Tour Guide
Ask me questions while you tour the home.