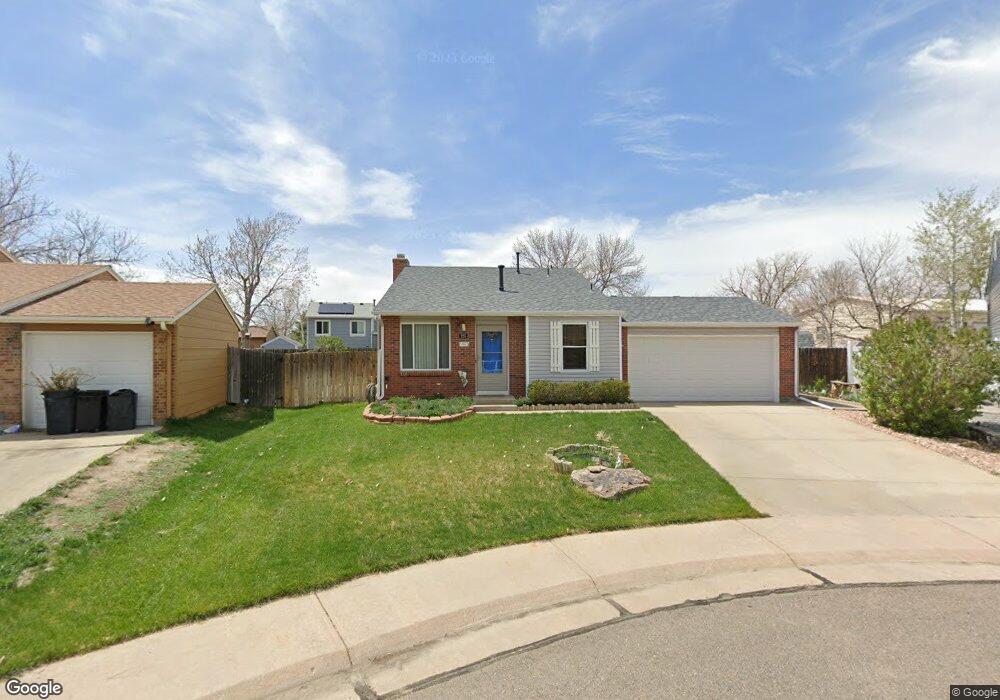
225 Hancock Way Bennett, CO 80102
Estimated Value: $358,818 - $381,000
3
Beds
1
Bath
1,210
Sq Ft
$306/Sq Ft
Est. Value
About This Home
This home is located at 225 Hancock Way, Bennett, CO 80102 and is currently estimated at $370,205, approximately $305 per square foot. 225 Hancock Way is a home located in Adams County with nearby schools including Bennett Elementary School, Bennett Middle School, and Bennett High School.
Ownership History
Date
Name
Owned For
Owner Type
Purchase Details
Closed on
Aug 14, 2013
Sold by
Craig Brenda L and Craig Donald R
Bought by
Craig Brenda L
Current Estimated Value
Home Financials for this Owner
Home Financials are based on the most recent Mortgage that was taken out on this home.
Original Mortgage
$112,800
Interest Rate
4.62%
Mortgage Type
New Conventional
Purchase Details
Closed on
May 7, 2002
Sold by
Craig Don R
Bought by
Craig Donald R and Craig Brenda L
Home Financials for this Owner
Home Financials are based on the most recent Mortgage that was taken out on this home.
Original Mortgage
$117,600
Interest Rate
7.1%
Purchase Details
Closed on
Jan 15, 1999
Sold by
Craig Don R and Craig Brenda L
Bought by
Craig Don R
Home Financials for this Owner
Home Financials are based on the most recent Mortgage that was taken out on this home.
Original Mortgage
$90,000
Interest Rate
6.68%
Create a Home Valuation Report for This Property
The Home Valuation Report is an in-depth analysis detailing your home's value as well as a comparison with similar homes in the area
Home Values in the Area
Average Home Value in this Area
Purchase History
| Date | Buyer | Sale Price | Title Company |
|---|---|---|---|
| Craig Brenda L | -- | Lsi | |
| Craig Donald R | -- | -- | |
| Craig Don R | -- | -- |
Source: Public Records
Mortgage History
| Date | Status | Borrower | Loan Amount |
|---|---|---|---|
| Closed | Craig Brenda L | $112,800 | |
| Closed | Craig Donald R | $117,600 | |
| Closed | Craig Don R | $90,000 |
Source: Public Records
Tax History Compared to Growth
Tax History
| Year | Tax Paid | Tax Assessment Tax Assessment Total Assessment is a certain percentage of the fair market value that is determined by local assessors to be the total taxable value of land and additions on the property. | Land | Improvement |
|---|---|---|---|---|
| 2024 | $1,158 | $22,060 | $5,000 | $17,060 |
| 2023 | $1,165 | $23,950 | $4,740 | $19,210 |
| 2022 | $1,141 | $20,050 | $4,730 | $15,320 |
| 2021 | $1,164 | $20,050 | $4,730 | $15,320 |
| 2020 | $1,564 | $18,360 | $4,860 | $13,500 |
| 2019 | $1,606 | $18,360 | $4,860 | $13,500 |
| 2018 | $1,470 | $15,300 | $4,320 | $10,980 |
| 2017 | $1,481 | $15,300 | $4,320 | $10,980 |
| 2016 | $977 | $10,440 | $2,150 | $8,290 |
| 2015 | $971 | $10,440 | $2,150 | $8,290 |
| 2014 | -- | $8,860 | $1,750 | $7,110 |
Source: Public Records
Map
Nearby Homes
- 704 Madison Way
- 128 Madison Dr
- 228 Ash St
- 46577 Sunflower Ln
- 46585 Sunflower Ln
- 46561 Sunflower Ln
- 46537 Sunflower Ln
- 46553 Sunflower Ln
- 46517 Sunflower Ln
- 46541 Sunflower Ln
- 46569 Sunflower Ln
- 46545 Sunflower Ln
- 46521 Sunflower Ln
- 46565 Sunflower Ln
- Clydesdale Plan at Muegge Farms - Coach House
- Belgian Plan at Muegge Farms - Coach House
- Freiberger Plan at Muegge Farms - Coach House
- Breton Plan at Muegge Farms - Coach House
- Suffolk Plan at Muegge Farms - Coach House
- Friesian Plan at Muegge Farms - Coach House
- 235 Hancock Way
- 215 Hancock Way
- 232 Harrison Dr
- 242 Harrison Dr
- 245 Hancock Way
- 212 Harrison Dr
- 210 Hancock Way
- 252 Harrison Dr
- 220 Hancock Way
- 230 Hancock Way
- 620 Centennial Dr
- 600 Centennial Dr
- 640 Centennial Dr
- 240 Hancock Way
- 580 Centennial Dr
- 257 Harrison Dr
- 560 Centennial Dr
- 235 Coolidge Ct
- 245 Coolidge Ct
- 225 Coolidge Ct