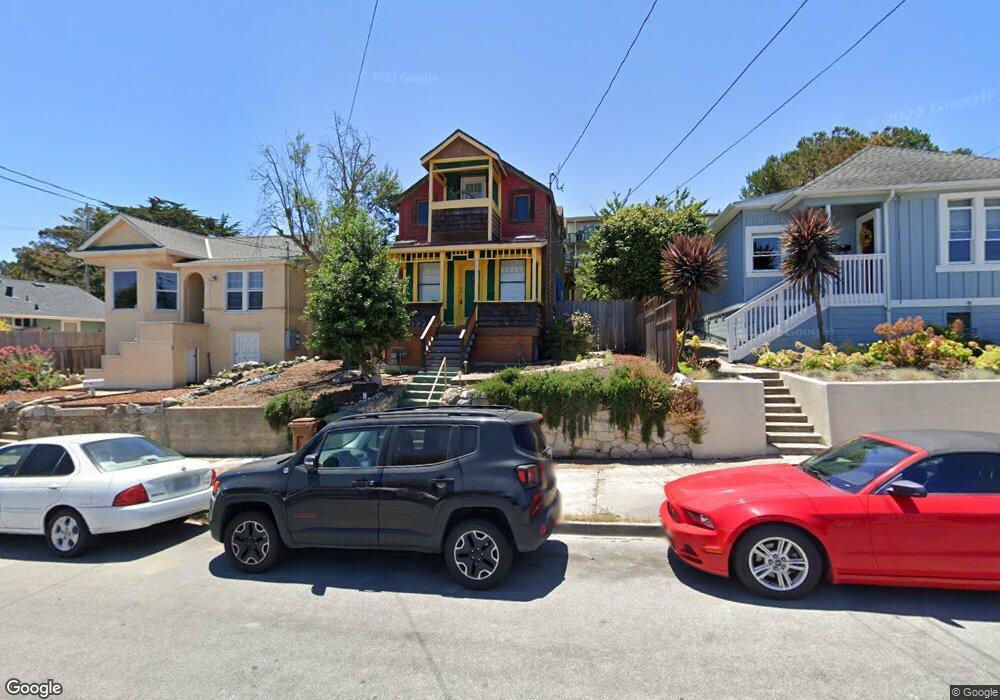
225 Hawthorne St Unit B Monterey, CA 93940
New Monterey NeighborhoodEstimated Value: $1,123,590 - $1,226,000
2
Beds
2
Baths
1,619
Sq Ft
$728/Sq Ft
Est. Value
About This Home
This home is located at 225 Hawthorne St Unit B, Monterey, CA 93940 and is currently estimated at $1,179,148, approximately $728 per square foot. 225 Hawthorne St Unit B is a home located in Monterey County with nearby schools including Monte Vista Elementary School, Monte Vista Middle School, and Monterey High School.
Ownership History
Date
Name
Owned For
Owner Type
Purchase Details
Closed on
Jan 19, 2021
Sold by
Meyer Rick
Bought by
Owen Amanda Eileen and Lewis Melissa Kate
Current Estimated Value
Purchase Details
Closed on
Jul 26, 2010
Sold by
Nugent Terry J
Bought by
Meyer Rick
Home Financials for this Owner
Home Financials are based on the most recent Mortgage that was taken out on this home.
Original Mortgage
$357,960
Interest Rate
4.71%
Mortgage Type
FHA
Purchase Details
Closed on
Sep 18, 2001
Sold by
Dwyer Alicia D
Bought by
Nugent Terry J
Purchase Details
Closed on
Dec 14, 1998
Sold by
Mccrone Willard P and Mccrone Carol C
Bought by
Dwyer Alicia D
Create a Home Valuation Report for This Property
The Home Valuation Report is an in-depth analysis detailing your home's value as well as a comparison with similar homes in the area
Home Values in the Area
Average Home Value in this Area
Purchase History
| Date | Buyer | Sale Price | Title Company |
|---|---|---|---|
| Owen Amanda Eileen | $855,000 | Chicago Title Company | |
| Meyer Rick | $318,000 | Chicago Title Company | |
| Nugent Terry J | $382,000 | Chicago Title Co | |
| Dwyer Alicia D | $61,500 | Chicago Title |
Source: Public Records
Mortgage History
| Date | Status | Borrower | Loan Amount |
|---|---|---|---|
| Previous Owner | Meyer Rick | $357,960 |
Source: Public Records
Tax History Compared to Growth
Tax History
| Year | Tax Paid | Tax Assessment Tax Assessment Total Assessment is a certain percentage of the fair market value that is determined by local assessors to be the total taxable value of land and additions on the property. | Land | Improvement |
|---|---|---|---|---|
| 2025 | $9,859 | $1,020,477 | $703,580 | $316,897 |
| 2024 | $9,859 | $1,002,332 | $689,785 | $312,547 |
| 2023 | $9,644 | $889,542 | $676,260 | $213,282 |
| 2022 | $9,510 | $872,100 | $663,000 | $209,100 |
| 2021 | $4,223 | $855,000 | $650,000 | $205,000 |
| 2020 | $5,122 | $372,523 | $234,291 | $138,232 |
| 2019 | $5,243 | $365,220 | $229,698 | $135,522 |
| 2018 | $5,008 | $358,060 | $225,195 | $132,865 |
| 2017 | $4,672 | $351,040 | $220,780 | $130,260 |
| 2016 | $4,524 | $344,157 | $216,451 | $127,706 |
| 2015 | $3,931 | $338,988 | $213,200 | $125,788 |
| 2014 | $4,403 | $332,348 | $209,024 | $123,324 |
Source: Public Records
Map
Nearby Homes
- 225 Hawthorne St
- 213 Hawthorne St
- 237 Hawthorne St
- 249 Hawthorne St
- 201 Hawthorne St
- 440 Reeside Ave
- 222 Laine St
- 222 Laine St Unit 10
- 460 Reeside Ave
- 261 Hawthorne St
- 260 Laine St
- 265 Hawthorne St
- 202 Laine St
- 200 Hawthorne St
- 212 Hawthorne St
- 236 Hawthorne St
- 224 Hawthorne St
- 248 Hawthorne St Unit 4
- 248 Hawthorne St
- 441 Reeside Ave