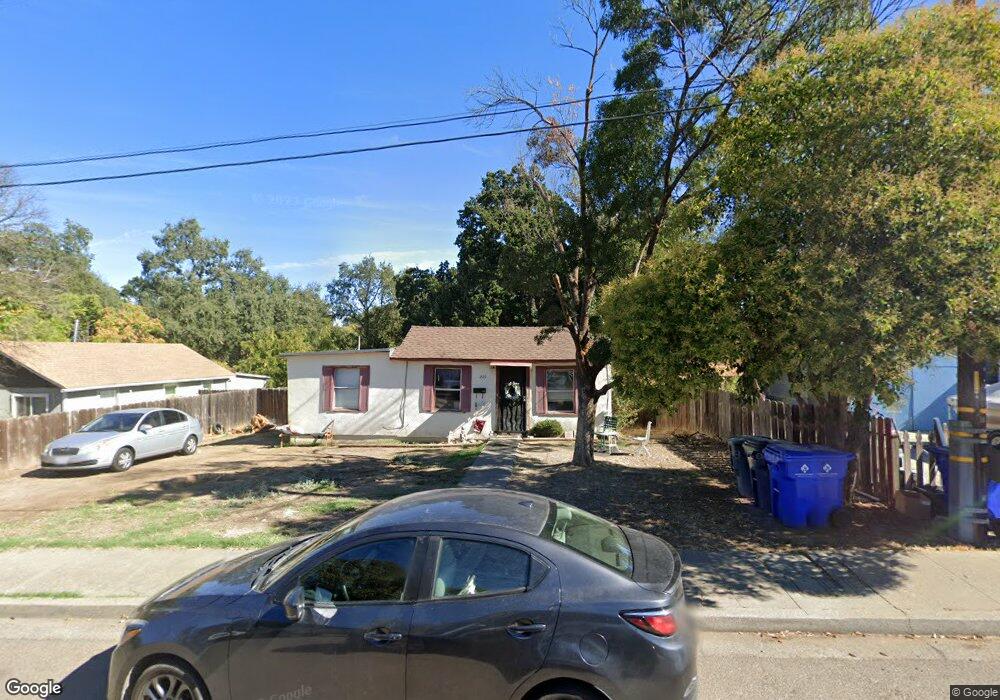
225 James Ave Red Bluff, CA 96080
Estimated Value: $165,000 - $241,000
2
Beds
1
Bath
850
Sq Ft
$232/Sq Ft
Est. Value
About This Home
This home is located at 225 James Ave, Red Bluff, CA 96080 and is currently estimated at $197,506, approximately $232 per square foot. 225 James Ave is a home located in Tehama County with nearby schools including Jackson Heights Elementary School, Vista Preparatory Academy, and Red Bluff High School.
Ownership History
Date
Name
Owned For
Owner Type
Purchase Details
Closed on
Jun 25, 2013
Sold by
Mcpherson Jon D
Bought by
Mack Margie
Current Estimated Value
Purchase Details
Closed on
Aug 17, 2009
Sold by
Hinkle Mary E
Bought by
Mcpherson Jon D and Mcpherson Jon D
Purchase Details
Closed on
Jun 7, 2007
Sold by
Hinkle Mary E and Hinkle Mary Ellen
Bought by
Hinkle Mary E
Home Financials for this Owner
Home Financials are based on the most recent Mortgage that was taken out on this home.
Original Mortgage
$225,000
Interest Rate
5.96%
Mortgage Type
Reverse Mortgage Home Equity Conversion Mortgage
Create a Home Valuation Report for This Property
The Home Valuation Report is an in-depth analysis detailing your home's value as well as a comparison with similar homes in the area
Purchase History
| Date | Buyer | Sale Price | Title Company |
|---|---|---|---|
| Mack Margie | -- | None Available | |
| Mcpherson Jon D | $58,000 | Placer Title Company | |
| Hinkle Mary E | -- | Fidelity National Title Comp |
Source: Public Records
Mortgage History
| Date | Status | Borrower | Loan Amount |
|---|---|---|---|
| Previous Owner | Hinkle Mary E | $225,000 |
Source: Public Records
Tax History
| Year | Tax Paid | Tax Assessment Tax Assessment Total Assessment is a certain percentage of the fair market value that is determined by local assessors to be the total taxable value of land and additions on the property. | Land | Improvement |
|---|---|---|---|---|
| 2025 | $684 | $73,876 | $36,938 | $36,938 |
| 2023 | $671 | $71,008 | $35,504 | $35,504 |
| 2022 | $665 | $69,616 | $34,808 | $34,808 |
| 2021 | $637 | $68,252 | $34,126 | $34,126 |
| 2020 | $649 | $67,554 | $33,777 | $33,777 |
| 2019 | $652 | $66,230 | $33,115 | $33,115 |
| 2018 | $602 | $64,932 | $32,466 | $32,466 |
| 2017 | $621 | $63,660 | $31,830 | $31,830 |
| 2016 | $635 | $62,412 | $31,206 | $31,206 |
| 2015 | -- | $61,476 | $30,738 | $30,738 |
| 2014 | $616 | $60,272 | $30,136 | $30,136 |
Source: Public Records
Map
Nearby Homes
- 660 Villa Dr
- 910 Aloha St
- 224 S Jackson St
- 821 Locust St
- 425 S Jackson St
- 406 S Jackson St
- 845 Olive St
- 180 S Main St
- 524 Madison St
- 532 Madison St
- 541 Jefferson St
- 195 Howell Ave
- 275 Howell Ave
- 0 Jefferson St Unit SN26036140
- 1270 Aloha St
- 1160 Orange St
- 728 Lincoln St
- 590 Brearcliffe Dr
- 1307 Deborah Dr
- 350 Gilmore Rd
Your Personal Tour Guide
Ask me questions while you tour the home.