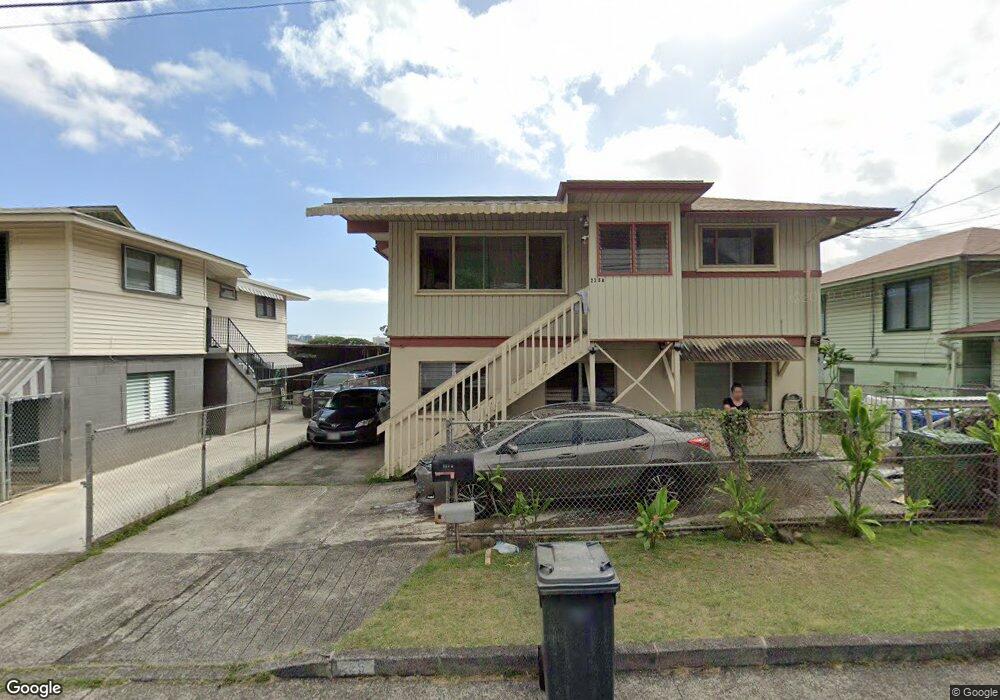
225 Kapalu St Honolulu, HI 96813
Nuuanu-Punchbowl NeighborhoodEstimated Value: $1,214,513 - $1,892,000
8
Beds
5
Baths
1,380
Sq Ft
$1,093/Sq Ft
Est. Value
About This Home
This home is located at 225 Kapalu St, Honolulu, HI 96813 and is currently estimated at $1,507,878, approximately $1,092 per square foot. 225 Kapalu St is a home located in Honolulu County with nearby schools including Pauoa Elementary School, Prince David Kawananakoa Middle School, and President Theodore Roosevelt High School.
Ownership History
Date
Name
Owned For
Owner Type
Purchase Details
Closed on
Mar 2, 2012
Sold by
Fuller Winona Leinaala and Book Katherine Naomi
Bought by
Fuller Shawn Kaleinamoku and Fuller Kimberly Ann Malia
Current Estimated Value
Home Financials for this Owner
Home Financials are based on the most recent Mortgage that was taken out on this home.
Original Mortgage
$150,000
Outstanding Balance
$102,990
Interest Rate
3.86%
Mortgage Type
Credit Line Revolving
Estimated Equity
$1,404,888
Purchase Details
Closed on
Dec 17, 2010
Sold by
Fuller Winona L and Book Katherine N
Bought by
Fuller Winona Leinaala and Book Katherine Naomi
Purchase Details
Closed on
Jan 4, 2006
Sold by
Countrywide Home Loans Inc
Bought by
Paiva Agnes De Lima and Agnes De Lima Paiva Revocable Trust
Purchase Details
Closed on
Jul 19, 2005
Sold by
Federal National Mortgage Association
Bought by
Countrywide Home Loans Inc
Purchase Details
Closed on
Nov 10, 1994
Sold by
Paiva Anthony and Paiva Agnes Delima
Bought by
Paiva Anthony and Paiva Agnes Delima
Create a Home Valuation Report for This Property
The Home Valuation Report is an in-depth analysis detailing your home's value as well as a comparison with similar homes in the area
Home Values in the Area
Average Home Value in this Area
Purchase History
| Date | Buyer | Sale Price | Title Company |
|---|---|---|---|
| Fuller Shawn Kaleinamoku | $1,000 | Fntic | |
| Fuller Shawn Kaleinamoku | $1,000 | Fntic | |
| Fuller Winona Leinaala | -- | None Available | |
| Paiva Agnes De Lima | $383,400 | Fntic | |
| Countrywide Home Loans Inc | $313,540 | Tg | |
| Paiva Anthony | -- | -- |
Source: Public Records
Mortgage History
| Date | Status | Borrower | Loan Amount |
|---|---|---|---|
| Open | Fuller Shawn Kaleinamoku | $150,000 | |
| Closed | Fuller Shawn Kaleinamoku | $150,000 |
Source: Public Records
Tax History Compared to Growth
Tax History
| Year | Tax Paid | Tax Assessment Tax Assessment Total Assessment is a certain percentage of the fair market value that is determined by local assessors to be the total taxable value of land and additions on the property. | Land | Improvement |
|---|---|---|---|---|
| 2025 | $4,781 | $1,321,500 | $897,600 | $423,900 |
| 2024 | $4,781 | $1,485,900 | $1,031,300 | $454,600 |
| 2023 | $4,388 | $1,453,700 | $990,000 | $463,700 |
| 2022 | $3,298 | $1,042,300 | $783,800 | $258,500 |
| 2021 | $3,021 | $963,000 | $742,500 | $220,500 |
| 2020 | $3,431 | $1,080,400 | $757,300 | $323,100 |
| 2019 | $3,224 | $1,001,000 | $705,300 | $295,700 |
| 2018 | $3,602 | $1,109,000 | $705,300 | $403,700 |
| 2017 | $5,036 | $1,059,600 | $590,900 | $468,700 |
| 2016 | $3,305 | $944,400 | $552,800 | $391,600 |
| 2015 | $3,128 | $893,600 | $526,100 | $367,500 |
| 2014 | $2,416 | $829,700 | $518,500 | $311,200 |
Source: Public Records
Map
Nearby Homes
- 2453 Pacific Heights Rd Unit C
- 2571 Kekuanoni St
- 2578 Pacific Heights Rd
- 2122 Tantalus Dr
- 2771 Pacific Heights Rd
- 238 Naone St
- 2960 Laola Place Unit A
- 756 Iaukea St
- 322 Auwaiolimu St
- 2153 Booth Rd
- 3075 Pacific Heights Rd
- 2143 Booth Rd
- 2138 Kanealii Ave
- 2134 Kanealii Ave
- 3233 Pacific Heights Rd
- 2001 Kamalalehua Place
- 21 Craigside Place Unit 8D
- 2101 Nuuanu Ave Unit I301
- 2101 Nuuanu Ave Unit I303
- 55 S Judd St Unit 803