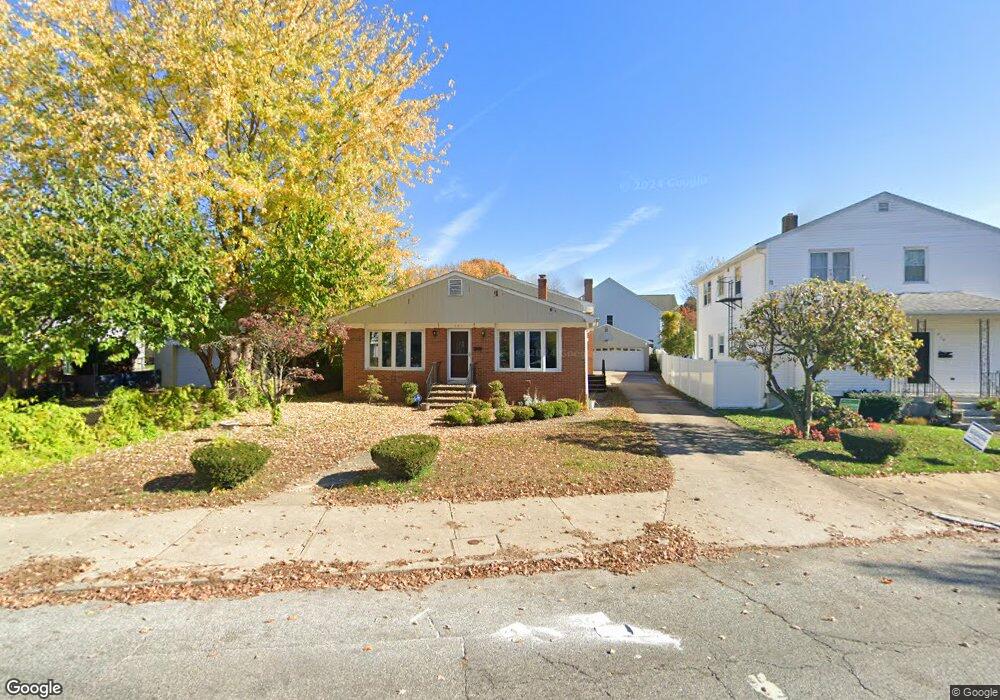
225 Langdon St Providence, RI 02904
Charles NeighborhoodEstimated Value: $485,000 - $537,000
4
Beds
3
Baths
2,724
Sq Ft
$185/Sq Ft
Est. Value
About This Home
This home is located at 225 Langdon St, Providence, RI 02904 and is currently estimated at $504,085, approximately $185 per square foot. 225 Langdon St is a home located in Providence County with nearby schools including Times Squared Academy, Times2 Elementary School, and The San Miguel School.
Ownership History
Date
Name
Owned For
Owner Type
Purchase Details
Closed on
Jul 8, 2025
Sold by
Long Loun and Hunt Sodee
Bought by
Paini Eugene and Hernandez Marilexis R
Current Estimated Value
Home Financials for this Owner
Home Financials are based on the most recent Mortgage that was taken out on this home.
Original Mortgage
$380,000
Outstanding Balance
$378,063
Interest Rate
6.89%
Mortgage Type
New Conventional
Estimated Equity
$126,022
Purchase Details
Closed on
Mar 3, 2022
Sold by
Leo Patricia M
Bought by
Hout Sodee and Long Loun
Home Financials for this Owner
Home Financials are based on the most recent Mortgage that was taken out on this home.
Original Mortgage
$327,000
Interest Rate
3.69%
Mortgage Type
Purchase Money Mortgage
Purchase Details
Closed on
Jun 19, 2020
Sold by
Leo Patricia M and Leo William A
Bought by
Leo Patricia M
Purchase Details
Closed on
Dec 6, 2010
Sold by
Giorgianni Antonio S and Giorgianni Mttia
Bought by
Leo William A and Leo Patricia M
Home Financials for this Owner
Home Financials are based on the most recent Mortgage that was taken out on this home.
Original Mortgage
$168,000
Interest Rate
4.22%
Mortgage Type
Purchase Money Mortgage
Create a Home Valuation Report for This Property
The Home Valuation Report is an in-depth analysis detailing your home's value as well as a comparison with similar homes in the area
Home Values in the Area
Average Home Value in this Area
Purchase History
| Date | Buyer | Sale Price | Title Company |
|---|---|---|---|
| Paini Eugene | $475,000 | -- | |
| Paini Eugene | $475,000 | -- | |
| Paini Eugene | $475,000 | -- | |
| Hout Sodee | $365,000 | None Available | |
| Hout Sodee | $365,000 | None Available | |
| Hout Sodee | $365,000 | None Available | |
| Leo Patricia M | -- | None Available | |
| Leo Patricia M | -- | None Available | |
| Leo Patricia M | -- | None Available | |
| Leo William A | $210,000 | -- | |
| Leo William A | $210,000 | -- |
Source: Public Records
Mortgage History
| Date | Status | Borrower | Loan Amount |
|---|---|---|---|
| Open | Paini Eugene | $380,000 | |
| Closed | Paini Eugene | $380,000 | |
| Previous Owner | Hout Sodee | $327,000 | |
| Previous Owner | Leo William A | $25,000 | |
| Previous Owner | Leo William A | $168,000 |
Source: Public Records
Tax History
| Year | Tax Paid | Tax Assessment Tax Assessment Total Assessment is a certain percentage of the fair market value that is determined by local assessors to be the total taxable value of land and additions on the property. | Land | Improvement |
|---|---|---|---|---|
| 2025 | $3,685 | $438,700 | $137,500 | $301,200 |
| 2024 | $6,096 | $332,200 | $90,200 | $242,000 |
| 2023 | $6,096 | $332,200 | $90,200 | $242,000 |
| 2022 | $5,180 | $291,000 | $90,200 | $200,800 |
| 2021 | $6,157 | $250,700 | $71,400 | $179,300 |
| 2020 | $6,157 | $250,700 | $71,400 | $179,300 |
| 2019 | $6,157 | $250,700 | $71,400 | $179,300 |
| 2018 | $6,939 | $217,100 | $55,200 | $161,900 |
| 2017 | $6,939 | $217,100 | $55,200 | $161,900 |
| 2016 | $6,939 | $217,100 | $55,200 | $161,900 |
| 2015 | $6,143 | $185,600 | $55,800 | $129,800 |
| 2014 | $6,264 | $185,600 | $55,800 | $129,800 |
| 2013 | $6,264 | $185,600 | $55,800 | $129,800 |
Source: Public Records
Map
Nearby Homes
- 45 Leo Ave
- 10 Josephine St Unit 207
- 10 Josephine St Unit 310
- 862 Charles St
- 3 Victor Emanuel Ave
- 19 Newbury St
- 730 Charles St
- 20 Hurdis St Unit 1
- 19 Benedict St
- 93 Paul St
- 209 Windmill St
- 136 Windmill St
- 62 Russo St
- 31 Washington St
- 0 Piave St
- 119 Edgeworth Ave
- 40 Wilna St
- 559 Branch Ave
- 1002 Charles St
- 3 Cassisi Ct
Your Personal Tour Guide
Ask me questions while you tour the home.